Abstract
Currently, each headphone manufacturer develops frequency response sound targets using proprietary methods. There is no dominant standard on how to measure headphone frequency response. The measurement equipment that is available on the market, yields diverging results, and none matches human perception to a sufficient degree. Also, the headphones on the market exhibit very little consistency of frequency response, even within a single manufacturer’s catalog. Furthermore, our research shows that user preferences are also varied and do not converge on one sound target, and in 78% of the cases, consumer experience can be enhanced through frequency response target personalization.
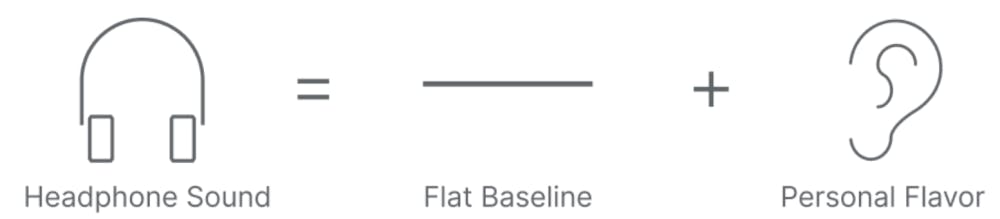
Sonarworks has developed a headphone frequency response measurement methodology that yields result closely matching human perception. Based on this methodology, we propose a new standard in headphone tuning, the SoundID SR, which suggests looking at the headphone sound as a sum of two components: a neutral baseline that matches the sound heard by content creators in the studio and a curve that’s either designed by the manufacturer or personalized on a user level. The baseline should be designed to sound as neutral (flat) calibrated near-field stereo studio monitor speakers, as heard by a human in a reasonably treated recording studio room. We propose a methodology for validating the accuracy of headphone calibration and provide headphone measurement as a service.
Writing this paper is aimed at contributing to the industry by proposing a better way of measuring and tuning headphones based on insights from our data. We believe current headphone measurement practices are far from optimal and agreeing on a common measurement approach is long overdue. Manufacturers, service providers, and users would all benefit from more updated practice standards.
Background of sound reference
Amplitude frequency response (referred to as frequency response in this paper or FR) is a technical parameter characterizing sound devices. It has been argued before [1] that frequency response is the number one factor determining how the listener perceives a speaker system. After years of research at Sonarworks, we have doubled down on this premise. Psychoacoustically frequency response on reasonably well-designed devices has the dominant impact on the perception of sound quality with other technical parameters becoming relevant only after the desired frequency response has been achieved. However, the understanding of the optimal frequency response measurements and targets for headphones is still in the early stages of development. In this paper, we will thus focus on frequency response measurements and targets for headphones.
The naive golden standard for audio reproduction is that what’s being reproduced should sound like a real-world performance. The problem lies in the fact that once the sound event gets captured by the microphone, the “reality” becomes a subject of interpretation. What’s more, many sounds nowadays are synthesized digitally therefore they have no real-life reference. The closest thing to a reference in modern soundcraft is what the engineer hears in their control room. After all, that’s where the end result is examined and decided to be good enough to be published. While there is a recent trend toward more mixing and mastering of sound content on headphones, it is the loudspeakers that are still the primary reference medium for sound.
Headphone sound reference
The existing international standards regarding headphones are concerned with sound pressure levels (SPL), sound isolation, or noise canceling. While there have been previous attempts to establish a standard for headphone-specific target frequency response, none has reached widespread industry adoption. The earliest notable attempts were:
- Free field target – achieved by placing a head and torso simulator (HATS) in front of a known on-axis flat frequency response loudspeaker in an anechoic chamber (free field). The headphone is then referenced on the same HATS measurement tool towards the loudspeaker target. We refer to HATS without referring to any specific manufacturer.
- Diffuse field target – the procedure is identical to capturing the free field target, except the environment is highly reflective (as opposed to the free field). It is typically done as a series of free-field measurements at different angles as it’s more practical than building a true diffuse field environment and leads to more precise high-frequency measurements.
Both free and diffused field measurements result in clear and repeatable data that brings comfort to the scientific approach. Unfortunately, when implemented as calibration the resultant headphone sound is tonally different from how a well-performing speaker would reproduce the same signal [2].
An alternative to the free and diffuse field methods is using in-room loudspeaker systems as a reference point. One of the more notable examples of this approach is the target curves devised by Harman researchers Sean Olive and Todd Welti [2]. These target curves are commonly referred to as the Harman curve. It was created by placing a pair of tuned speakers in a Harman listening room and measuring the frequency response with a modified version of a market-available HATS system. We find that the Olive-Welti approach is much better for delivering good-sounding headphones, however, it too isn’t adopted widely enough to be considered a standard.
Currently, most headphone manufacturers use listener panels to arrive at the final tuning of headphones, causing immense variation in headphone performance.
The current state of headphone sound: They all sound different
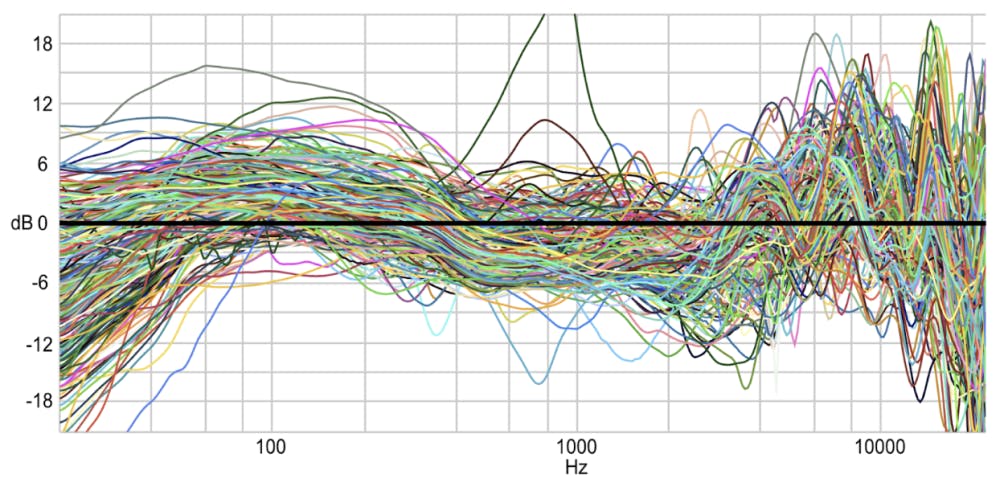
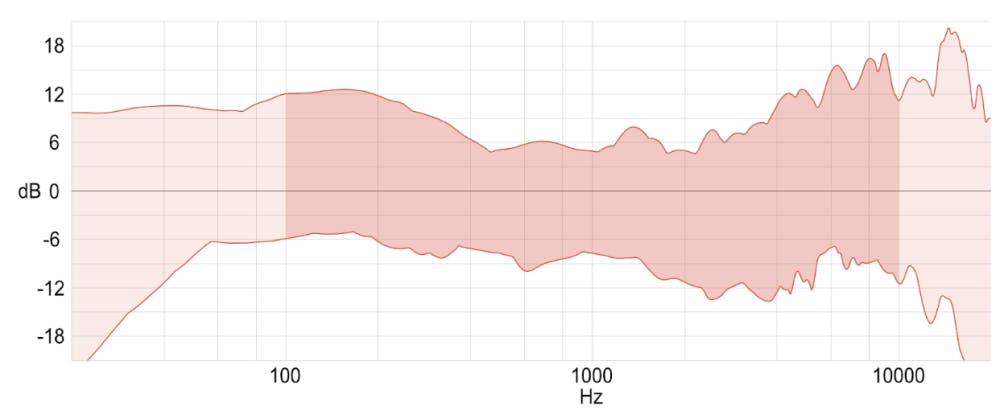
Sonarworks engineering team has come to the conclusion that there is no common ground on how headphones sound. This is based on over 7000 measurements of headphone frequency responses for more than 10 years. Across 400 selected models (figure 1) with multiple units measured for each model and measured by the same in-house developed method, the 95% confidence interval for frequency response is +/-22dB in the range from 20Hz to 20kHz and +/-13dB in the range from 100 Hz to 10kHz (figure 2).
The reasons behind this are threefold:
- Most headphones are designed and voiced by an engineering team with few people making decisions about the final sound.
- In the marketing of headphones, a certain specific sound coloration is often used as a differentiation factor.
- Often headphones will be shipped despite having audible acoustic artifacts.
The current state of things is a lose-lose scenario for manufacturers, professionals, and consumers. It is almost impossible to know what sound one will get from specific headphones and understanding the target sound of consumer headphones for the sound content creators is an impossible task.
In addition, there is no correlation between headphone price and frequency response [3].
Headphone measurement tools produce diverging results
The frequency response measurement rigs available today are insufficient at representing how headphones sound to humans. The main purpose of these devices is to indicate technical flaws in headphones like resonances and reflections.
To illustrate the gross inconsistencies in the available measurement equipment, one only needs to consult the graphs below where the same pair of headphones has been tested using different measurement systems.
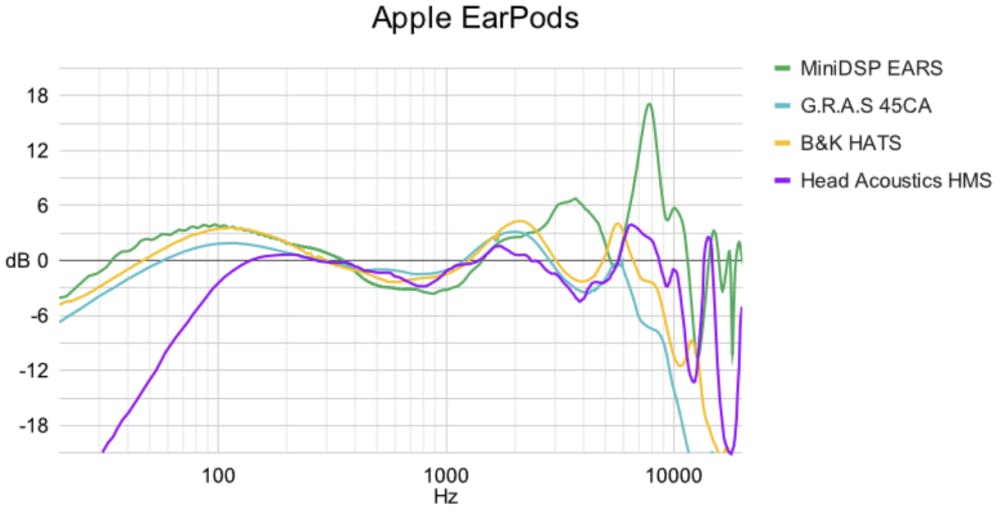
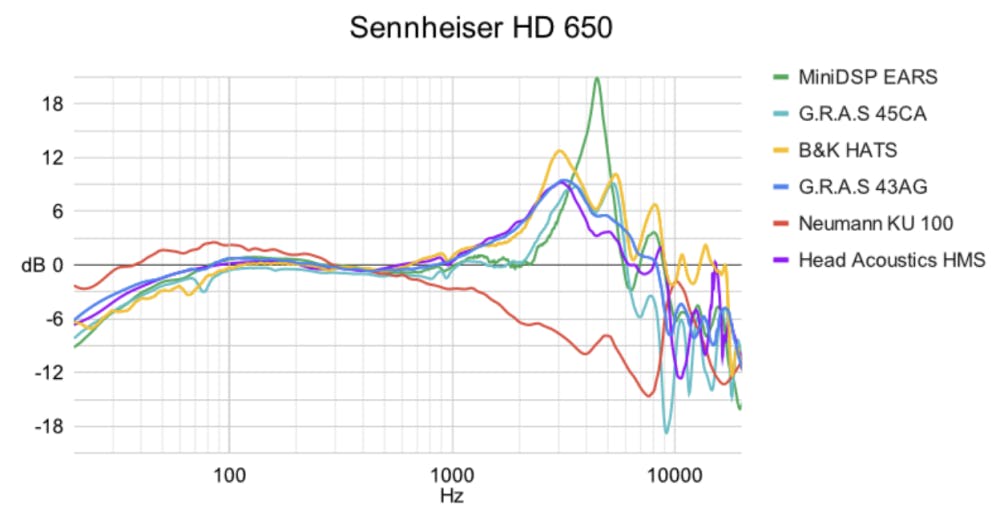
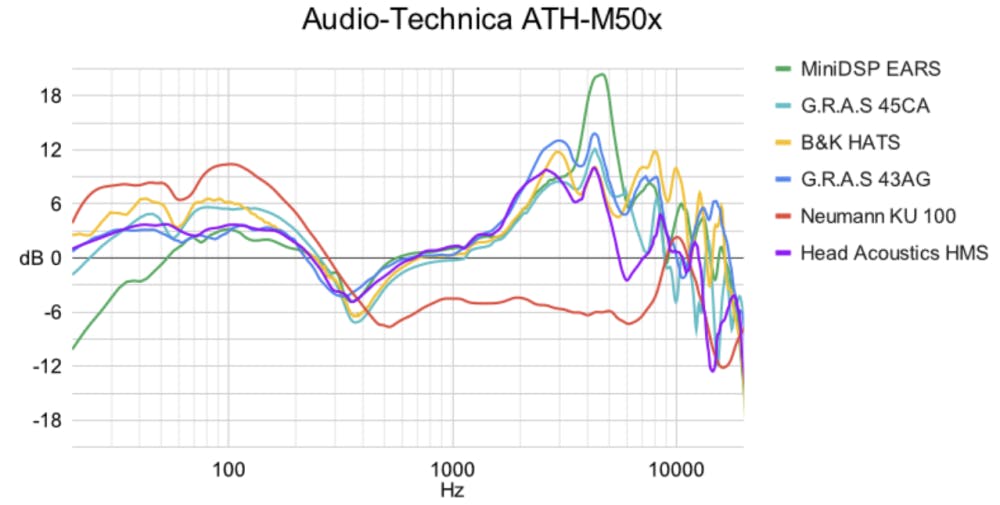
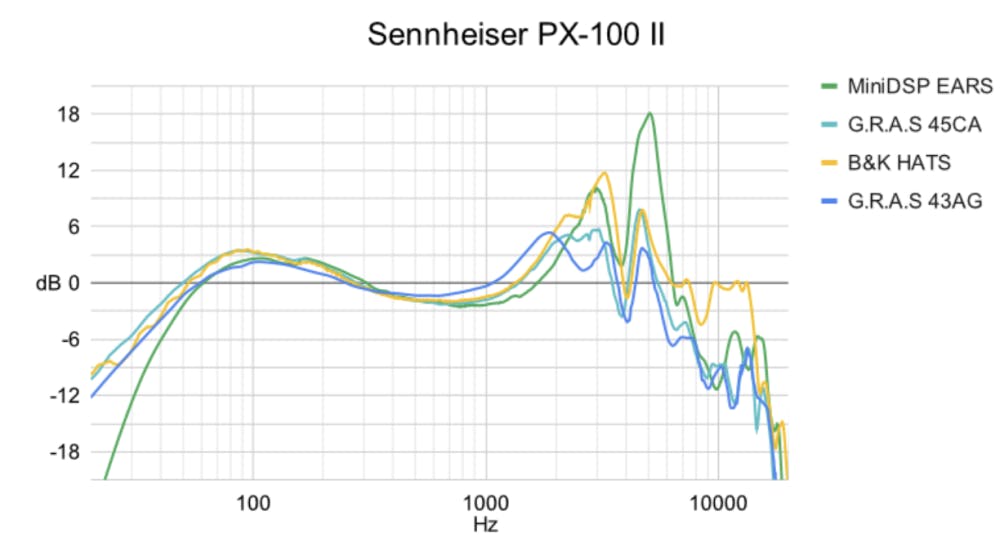
While there are no compensation curves applied to the measurements shown in figure 3, it’s evident that the differences between measurement tools are not consistent across graphs. This means that in order to yield matching results for every headphone model, a single compensation curve for each measurement rig would not be sufficient. It would require unique compensation curves specific to each headphone and measurement tool combination to solve this problem.
To conclude, as of 2022, the headphone industry has not adopted a common headphone frequency response measurement and target standard. There has been a lot of debate about targets both in previously published research papers as well as in various online communities. We want to stress that such debates are only relevant within their own framework. To illustrate this point let’s use flat frequency response as an example. If several headphones are measured using the same methodology then there is merit to discuss the differences, however, if measurements have been done using different measurement devices then it makes no sense to compare the results. This means that “flat” using one methodology does not translate to “flat” using another measurement device or methodology.
There is no universal headphone sound target: Consumer preferences do not converge
The method of consumer preference discovery
Standardizing headphone sound requires both a robust measurement method and an understanding of the target. First, we will address the target.
We use several methods to research consumer preferences, however, most data has been gathered employing the A/B comparison methodology. For A/B comparison the user selects content for playback and is then given 2 different sound targets as instantly switchable A and B options. The user then chooses the preferred choice or indicates that a clear preference can not be made. There are several A/B test design features that we employ to increase the reliability of this kind of test:
- All headphones used during the test are pre-measured and calibrated for the same flat frequency response that is matched to flat room calibrated studio monitors. Predesigned sound target variations are then added on top of the reference calibration. These targets will be called calibrated targets in this paper.
- During A/B comparisons, the original uncalibrated sound of headphones is also used to gain information about an additional set of potential sound targets to understand their relative performance compared to calibrated targets.
- A/B sound targets are loudness equalized to avoid loudness-influenced preferences
- A/B target pairs are chosen to have considerable sonic differences. This is an important step to increase the reliability of the A/B comparison.
Overall we have analyzed data on 235 calibrated targets. These targets were generated using bell and shelf filters with variable Q and center frequency amplitude factors. The targets in our dataset were generated using filters applied at 8 different frequencies contained to a maximum of 3 filters per target. The filter amplitude change (gain) is varied in steps of 3dB for most targets and a few having steps of 1.5dB. Figure 4 has 3 examples.

The A/B testing was carried out using Android and iOS based smartphone apps. Multiple targets are A/B tested against each other during each comparison session. In order to determine the preferred choice for a particular user one best performing target is found out of many. Each time a target is selected as preferred, it gives that target score points and the final user preference is selected as a target with the highest point score. The choice of the exact targets to be selected for comparison is based on data of previous selections by all users. In addition, results from tests using 20 different content tracks representing major music genres are combined.
We find that A/B comparisons when implemented properly have a lot of advantages. In an instant, blind-type A/B test users can make a clear preference choice and do multiple comparisons very quickly without having psychological listening fatigue. Having all headphones used during the tests calibrated to the same baseline reference target enables the combining of data from multiple users and the creation of advanced statistical models for sound preference analysis.
Everybody likes something else
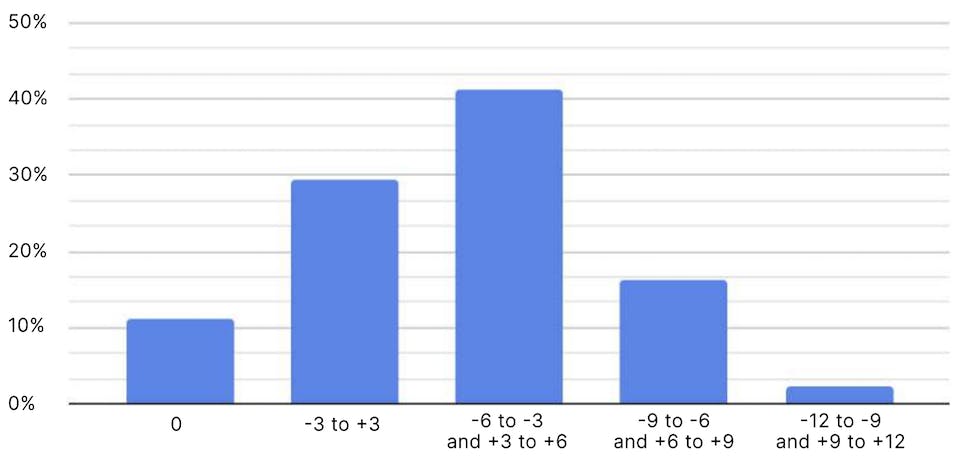
After performing headphone sound preference A/B testing involving 147 000 individuals, the results revealed up to +/-12dB deviations on top of neutral frequency response for consumer preferences (Figure 5). For this research, we collected a database of more than 2.4 million A/B comparisons with each user on average performing 16 A/B comparisons. After doing all the comparisons each user has only one best-performing target as a preference result. As a simplified way of showing the results, we divided the final user preferences into groups depicting the amplitude difference from flat frequency response in +/-3 dB ranges. 41% of users will end up picking a preference in the +3dB to +6dB range and -3dB to -6dB range making it the most popular preference range. Each interval (bar) represents multiple targets from a set of 235 calibrated targets. Only the neutral target (0) is represented by a single bar which is the preferred choice of about 11% of participants.
users
Now that we have covered the method of consumer preference discovery and what targets are chosen more frequently, the next step is to analyze how these targets perform relative to each other on an aggregated level.
For this, we selected 639 different sound targets from the database that consisted of 235 calibrated targets on top of flat frequency response and 404 different uncalibrated headphone profiles as targets (the original sound of headphones). In total this dataset represents 1.99 million A/B comparisons. To look at the aggregate picture for each specific target we devised a probability score representing how likely the specific profile is to be selected as a winning choice in an A/B comparison. A probability to win of 40% would mean that a particular sound target would be selected as preferred in 4 out of 10 A/B comparisons with other targets.
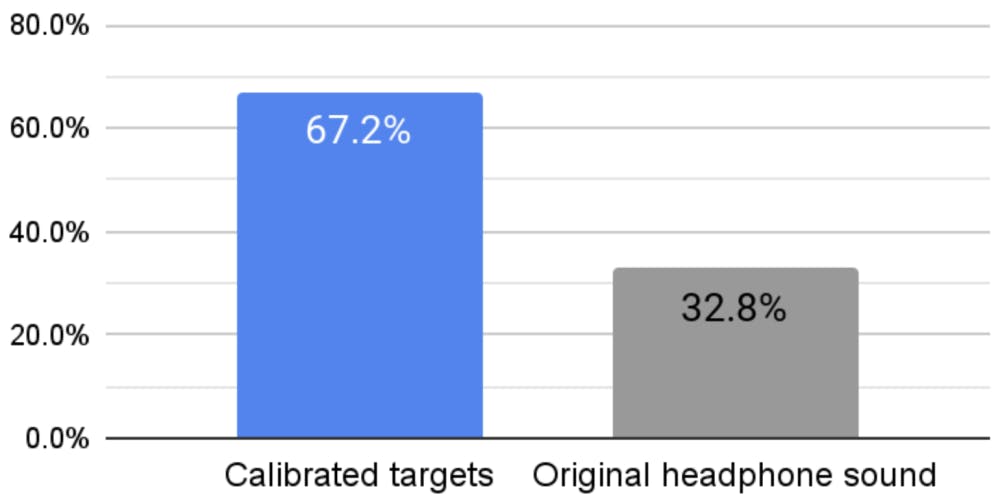
As illustrated in figure 6, the average score for uncalibrated headphones is 32.8% whereas calibrated targets have an average score of 67.2%. These scores are weighted according to the total number of A/B comparisons done for each target. This data indicates that on average calibrated targets are chosen twice as often compared to uncalibrated headphones. We have 2 hypotheses to explain this phenomenon:
- Digital calibration gets rid of acoustic artifacts that seem to be hard to deal within hardware design alone. Having dips and peaks in the uncalibrated frequency response increases masking effects and thus decreases intelligibility on the consumed content material.
- The calibrated targets have smoother frequency responses thus sonically being closer to the references used in content production.
The above analysis is an average aggregate perspective. At Sonarworks we are using this data to develop algorithms that can find the best possible personal preferences for users in the shortest possible time. At the time of writing this paper, our best-performing algorithm can find a better-preferred target to the original headphone sound for 78% of users, however, the most preferred sound profiles end up being different for different people.
We argue that our data shows that there is no one sound to be liked by everyone. It is not that the industry does not know enough about consumer preferences, but rather the fact that consumers do not converge on one target. We find this conclusion very obvious on a personal experience level where most of us are well aware that personal experiences based on human senses are very individual. As an analogy, nobody would try to argue that bananas taste better than strawberries. The hearing sense is like all other senses also very individual and depends also on previous experience.
Background to standardizing headphone measurements
As has been shown in the previous chapters: there is no readily available headphone measurement technology on the market that would give reliable measurement data and targets for sound calibration. In addition, on average consumer sound preferences do not converge on one sound choice and prefer calibrated targets over unaltered headphone sound. This means there is no one ultimate sound that headphones have to be tuned to. There is still, however, a lot of benefit from establishing a common measurement baseline as a frame of reference. A clear understanding of the sound that is being designed by the manufacturer is paramount in order to ensure consistency, accuracy, and progress. The current state of headphone sound without clearly defined sound standards is like going in circles: a successful design iteration in one product does not lead to the same or better following product. By changing the components or ergonomics of the following product, the sound is often unwillingly compromised.
We are proposing a solution to this rather complicated state of things that is a win-win for both the headphone manufacturer and the consumer. In the speaker realm, it is agreed to design speakers using free field measurements and then add room calibration on top of it. Similarly, we are proposing a two-layer approach for headphones. First, measuring headphones to a baseline target as a reference point, and second adding flavor on top of it. The baseline reference should be shared across the industry ensuring repeatable and consistent sound. The flavor should be a conscious design choice resulting in different sound for different headphones and users.
As an analogy, in other industries, the use of metric vs imperial measurement systems can cause confusion and difficulties. In the headphone industry, manufacturers not only come up with their own measurement systems but there’s also no way to convert between them. For the headphone industry, a common reference point will enable data-based design choices and consistency across products.
The baseline target for headphone sound
We are proposing that as a baseline headphone frequency response should be designed to sound as neutral (flat) calibrated near-field stereo studio monitor speakers, as heard by a human in a reasonably treated recording studio room. Studio monitors are used to create the content that is reproduced by headphones, hence it makes most sense to employ that as a baseline. Content creators use studio monitors first and foremost to verify that their process has produced something that sufficiently expresses their creative intent. Employing the same studio sound target as a reference ensures the closest possible result to the artist’s intent. Choosing any other reference target seems arbitrary due to consumer preferences being individual.
Using recording studios is also a highly practical baseline target as they are easily available across the globe. A certain advantage compared to the need for an anechoic chamber. In addition, a studio environment can be calibrated with very high accuracy as we have demonstrated using Sonarworks SoundID reference software (+/-0.9dB).
Another data point in favor of the flat being chosen as the baseline is that for the 67 000 studio speaker setups around the world that are calibrated using Sonarworks SoundID Reference software, in 73% of the cases, the flat target is the preferred choice by the content creators.
How to measure and verify headphones for flat reference baseline
Designing a headphone in the sense of achieving a FR target can mean acoustical design as well as digital signal processing. The most crucial component of this proposal is to focus on human perception and in-room speaker reference rather than fixed measurements made by headphone measurement tools. Sonarworks does use proprietary measurement equipment, however, it is developed with human perception as a reference point and the results are always verified by a team of specifically trained human listeners.
The process of calibrating headphones to baseline flat should be carried out as a 3 step process:
- Calibrate studio monitors in a studio room to flat frequency response
- Calibrate headphones using Sonarworks measurement service or using other available tools
- Validate the results using trained critical listeners.
The starting point for achieving and validating a target sound for headphones is speaker calibration. Audio professionals can calibrate studios with many different tools to achieve the desired sound. SoundID Reference calibration software is one such tool available in the market that enables anyone to calibrate their loudspeakers for tonal accuracy. It’s done by performing a series of measurements in the room and applying corrective filtering via digital signal processing. The advantage of using SoundID Reference software for calibration is the simplicity of use, reliance on a lot of measurement data, and guaranteed accuracy of the final result. SoundID Reference software minimizes human error due to measurement technology that ensures accurate microphone placement for multiple measurement points. In addition, the accuracy of SoundID Reference calibration software is already validated by tens of thousands of recording industry professionals in all imaginable studio environments.
The second step in the process is measuring headphones. There are many different methods and tools to measure headphones, however, as shown earlier in this paper, the market available tools deliver substantial variance in the results. We have no data about various 3rd party in-house developed measurement tools. Sonarworks has developed a proprietary measurement process that is available as a service, however, at the end of the day what matters is that the measurements correspond to the human listener experience.
We are proposing that the final verification and 3rd step of achieving a flat sound target is result validation by human listeners comparing the headphones to calibrated studio monitors. There are several elements to increase validation accuracy by a trained human listener:
→ Using a panel of 5 human listeners to be able to deal with individual discrepancies
→ Both listening devices should be volume matched
→ The chosen sound (music) for comparison should be with rich content across the full spectrum to make comparison easier for human listeners. Using short loops also increases accuracy by allowing listeners to focus.
Unfortunately, there is no commercially available hardware/tool giving frequency response results that closely correlate to our proposed in-room target so validating by human perception is the best possible process.
The sound flavor on top of the baseline
After achieving the flat reference sound for the particular headphone it is important to remind the reader that only about 11% of the end consumers will find flat frequency response as preferred. Adding flavor on top of a flat baseline is a requirement for an enjoyable sound experience by consumers.
We strongly believe that the ultimate objective for headphone sound should be personalization on an individual level, however, such an approach requires advanced user interfaces and some input from the end consumer that is not always practical or technically possible. The final flavor of headphone sound can also be designed as a fixed-sound solution to the manufacturer’s taste, data, or philosophy. Some headphone companies have a long tradition and brand behind their specific sound and will not be ready to switch to a user-centric paradigm allowing the end user to define the sound. We would argue that even those manufacturers would benefit from thinking about their sound as consisting of baseline and flavor. Accurate baseline measurement would allow more controlled design choices and consistency within the brand or product line. Sonarworks has an individual personalization solution as well as aggregated data for optimal one sound target tuning, however, it is a vast topic that deserves a separate whitepaper.
Headphone calibration as a service
After realizing the unreliability of headphone measurement tools available on the market, Sonarworks spent 10 years of research to perfect a set of tools and methods to achieve psychoacoustically accurate measurements for all types of headphones. The measurement process employed by Sonarworks is rather complex and requires access to proprietary tools and data. Multiple measurement tools are used for each headphone measurement and the final result is in-house checked by an expert panel. At this point Sonarworks does not provide the headphone measurement tools as a separate hardware product, however, the corrective EQ data and measurements are provided by Sonarworks as a service.
Sonarworks provide two types of correction profiles: average which applies to all headphones of a certain model and individual which calibrates an individual unit of headphones. Headphones calibrated to flat frequency response by Sonarworks are frequency response wise matched to flat calibrated in-room studio monitor speaker systems. An expert listener doing an A/B test between a set of calibrated speakers and headphones should notice a difference in tonality not exceeding the accuracy parameters given in figure 7.
Sonarworks measures all headphone types as a service and provide:
→ A calibration profile that when implemented via DSP will ensure that the headphone is tuned for the desired target
→ A measurement report and analysis
A team of 5 trained in-house experts is used in order to deal with previously discussed limitations in human verification of the reference sound target. Trained listeners validate that the measured FR matches the reference target. Figure 7 shows a 90% confidence interval of the aggregate individual expert listeners max and min deviation from reference for all Sonarworks measured headphones. In order to maintain a high standard for accuracy that is required in the professional sound recording industry, there are rare cases where Sonarworks is not providing calibration for particular headphones. This can be due to 3 reasons: large unit sound variance within the same model, large sound variance for different human listeners, and presence of acoustic artifacts/defects that can not be adjusted by using digital filters. In cases where model-specific calibration of the headphone is not possible, Sonarworks can still provide measurement data as a reference point.
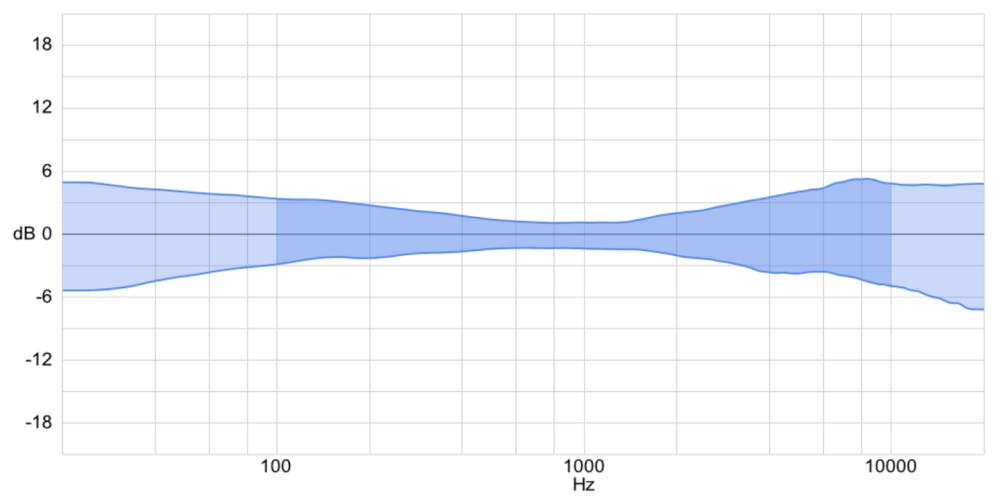
Sonarworks calibration as validated by the human listener panel is +/-3dB in the 200Hz to 2.5kHz range and +/-6 dB in the full audible range. The increased deviation at low frequencies is due to individual headphone to ear and head fit of experts and high frequencies are more affected by individual ear canal resonances and different geometries.
For a model average calibration profile, a minimum of 5 headphone units are required. These units should be selected from different production batches. Overall Sonarworks has already measured and calibrated over 875 headphone models based on more than 7000 individual headphone unit measurements. At the time of writing these headphone calibration profiles are used by over 100K sound professionals for mixing and mastering sound content.
Conclusions and Implications for the industry
Headphones have been at the forefront of the rapid development of mobile technologies. They have become the de-facto primary device for the reproduction of audio. Yet there are still no practical standards for the measurement and tuning of headphones. With the development of the internet of things and metaverses, we are rapidly moving toward sound-enabled multi-device ecosystems. Within these ecosystems, the uniformity of sound will be increasingly more important, and achieving that requires standardization. Sonarworks offer a solution to this problem by detailing a methodology of how to think about sound target and providing headphone measurements as a service.
This paper shows that consumers do not converge on one sound preference so it makes no sense to propose one particular target for all consumers. There is ground for headphone companies to develop their own unique targets or enable end users to personalize on an individual level.
Accurate headphone calibration to match flat in-room studio monitor frequency response baseline provides the following benefits:
- Make informed decisions about headphone design. Based on accurate headphone measurements leading to good design choices.
- Consistent sound experience across brand models. Consistent sound experience across different types of sound devices (headphones, speakers, cars)
- Calibrated headphones enable bridging the gap between headphones and medical hearing aids. Inaccurate frequency response of headphones can lead to false conclusions when detecting hearing problems.
- Headphone calibration enables the development of personalization technologies. Consistent headphone sound is crucial for personalization. Without sound consistency, the personalization is specific to that particular headphone. If personalization requires substantial user input, it can be prohibitive for optimal personalization of sound. At Sonarworks we strongly believe that personalization is the future of consumer sound.
References
[1] Olive, S. (2004). A Multiple Regression Model For Predicting Loudspeaker Preference Using Objective Measurements: Part 2-Development of the Model. presented at the 117th AES Convention, San Francisco, USA
[2] Olive, S., Welti T., & McMullin E. (2013), Listener Preferences for Different Headphone Target Response Curves. AES paper 8867.
[3] Breebaarta, J. (2017). No correlation between headphone frequency response and retail price. The Journal of the Acoustical Society of America 141, EL526 https://asa.scitation.org/doi/10.1121/1.4984044
The PDF version of the White Paper is available here.
Read our other findings and data reports here.