You’ve probably heard the phrase “use your ears” in reference to mixing or mastering before. While it’s not particularly helpful advice by itself, it’s typically used to point out the importance of developing and trusting your critical listening skills. But there are also benefits to using your eyes when mixing and mastering. In this blog, we’ll explain how using various meters and analyzers can help you create cleaner-sounding mixes free of technical problems.
Visual Aids
Generally speaking, audio analyzers are visual aids that provide technical information about a signal. They help us “see” loudness, frequency response, spatial information, and other characteristics about the audio. Supplementing what we hear, analyzers provide additional information about signals that help us make better mixing decisions. The adage “trust but verify” applies in this case—trust your ears, but verify with your meters.
When I used to teach audio production, I would often see my students using meters to replicate settings they read about online instead of using their ears to assess how the mix sounds. “We’re engine-ears, not engine-eyes,” I would tell them. However, analyzer plugins can help to visually identify problems and are especially useful aids while you’re honing your critical listening skills.
Types of Metering Plugins
Many DAWs offer a variety of built-in metering options. With so many metering options available, it may be helpful to do a review of some common types of meters. Generally speaking, most audio meters fall into one of three categories; level meters, frequency analyzers, and stereo imaging meters.
Audio Level Meters
The VU meter is the most common meter and it represents the average short-term loudness of a signal. They were designed to emulate the way the human ear perceives the energy or loudness of an audio signal during recording and mixing. VU meters have a moderately slow response time (300ms rise and fall), so they don’t show transients or peak levels, limiting their applications. Digital VU meters are often simply called RMS meters. VU meters are handy for monitoring the level of a mic preamp or analog signal processor, especially on voice.
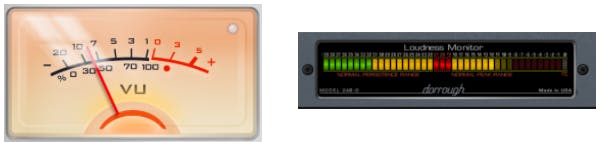
Peak Program Meters (PPMs), have a fast rise time and slow fallback time (< 10ms rise, 1.5- second fall) so they are better than VU meters for displaying peak audio levels, making them ideal for preventing clipping. Dorrough meters (pictured above), simultaneously display VU and PPM readings on the same meter and describe the relative loudness or density of a mix.
The LUFS meter, also called LKFS, is the modern meter for displaying the loudness of an audio program. LUFS meters display the loudness of a track over time, based on the way our brain perceives sound. Anyone who produces commercial music or sound for TV, film, or streaming should learn about LUFS meters. For an in-depth look at measuring loudness, check out this article.
True-Peak metering is important during the mastering stage. Digital signals should never exceed digital zero (full scale), and the analog waveform that is recreated during the digital-to-analog conversion should not overload. True-peak or intersample peak meters display the peak level that a signal could produce when it is converted back to analog. Each streaming service provides a recommendation for their preferred maximum true-peak level, so this meter is an important part of the mastering chain.
The Peak to Loudness Ratio (PLR) represents the difference between the peak level and the average loudness of the song over the entire program. PLR really represents the dynamics or the crest factor of the music. Peak to Short-Term Loudness Ratio (PSR) meters display the dynamics for the previous three seconds, so PSR shows the realtime crest factor. Keep in mind that the dynamics of a song don’t indicate how loud a song is—LUFS does that. But, if two songs have a similar loudness, the one with greater dynamics will tend to feel more powerful. Try to keep the PSR greater than 8 during the loudest sections of your masters to avoid over compression.
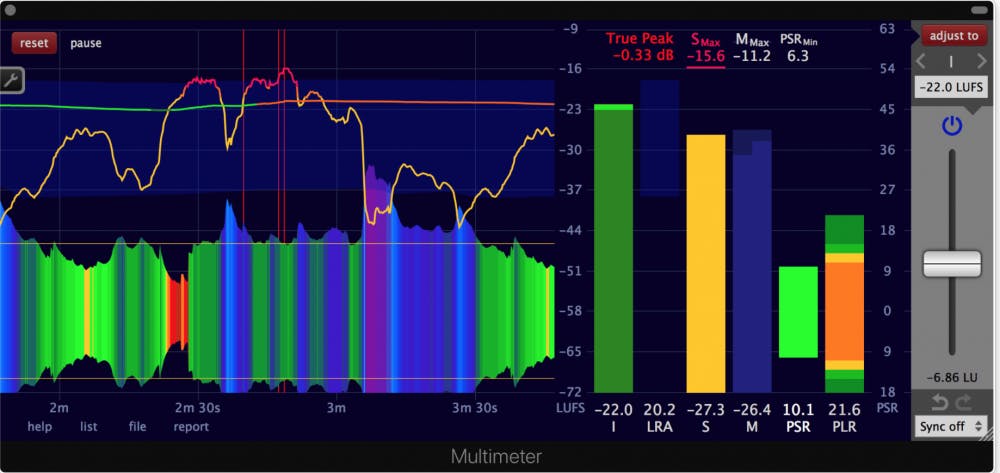
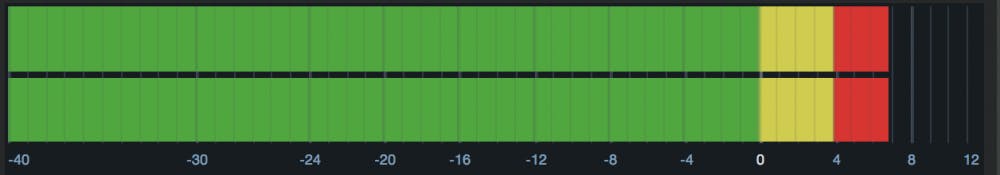
Most level meters should look familiar, while some of the new meters, like the Klangfreund Multimeter (pictured above), use unique graphical displays to show the energy levels of a mix over time. If your DAW doesn’t provide all these types of level metering, there are many third-party options available and we have provided a list of some of these meters at the end of this article.
Frequency Analyzers
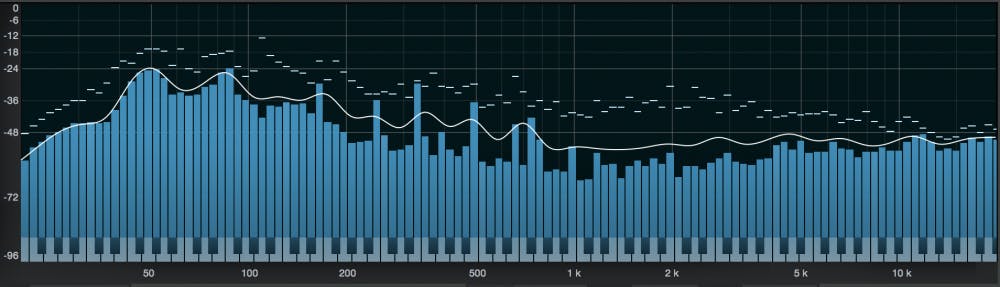
Spectrum analyzers, often referred to as Real-Time Analyzers (RTAs), help us visualize the tonal balance of an audio signal. They display the frequency content of a signal in real-time, allowing you to quickly identify how much energy lies in any particular frequency range. This can be especially helpful when trying to identify problems like mid-range muddiness or subharmonic rumble.
You should practice using a spectrum analyzer on songs that you are familiar with to learn to recognize the frequency spectrums (shapes) of different genres of music. For example, modern country songs have a different balance of high- and low-frequency energy than trap music.
Spectrum analyzers allow users to adjust parameters like response time, resolution, and dB range to tailor the look and feel of the meter to your preference. Many EQ plugins display a spectrum analyzer behind the EQ curve so that you can see how your EQ adjustments affect the audio signal. Many spectrum analyzers display a resolution fine enough to see which individual note values need to be adjusted in a signal.
Stereo Imaging Meters
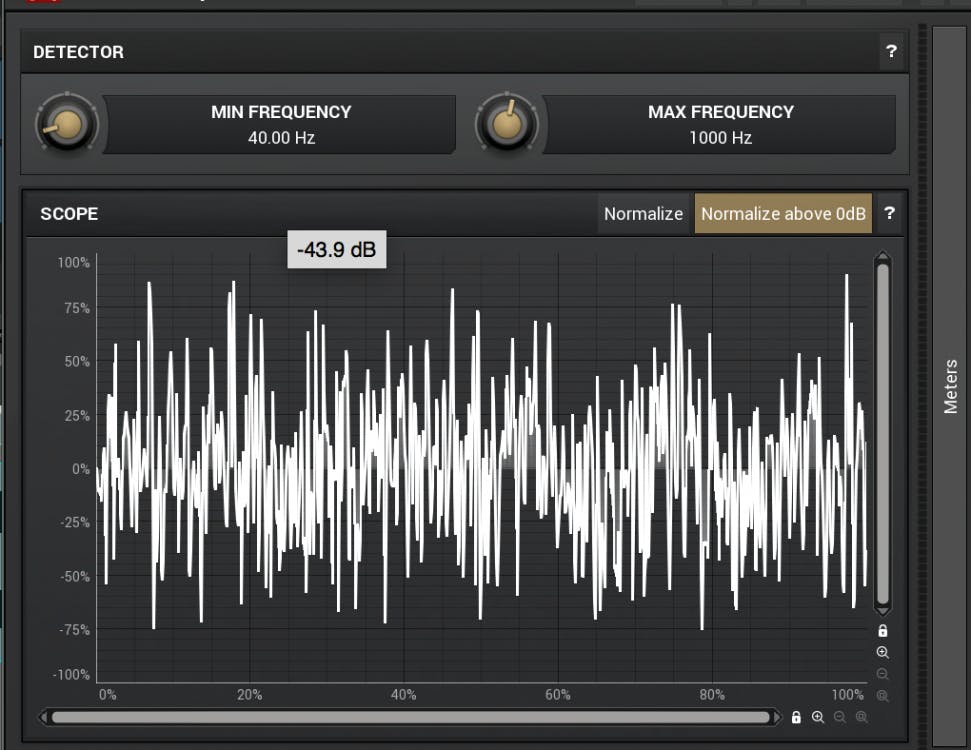
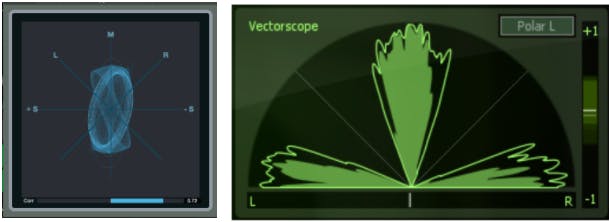
A traditional oscilloscope displays the level and frequency content of a signal over time. Special oscilloscopes called vectorscopes can be used during mixing and mastering to display the soundfield or stereo image of a mix over time. They’re great for visualizing the spread of a stereo mix to see any extremely narrow or wide moments.
Phase correlation meters simply display how much in-phase vs. out-of-phase content a mix contains. These simple meters warn us that there may be too much out-of-phase content in our mix. This is especially useful when tracking acoustic music with a stereo mic setup, but it is also useful for full pop-music mixes. Too much out-of-phase content can ruin mono-compatibility.
Some common vectorscope types include the goniometer (Lissajous meter) and polar level meters. Phase correlation meters typically display an indicator that floats between a range from -1 to +1, where +1 represents identical information in the left and right channels (in-phase) and -1 represents completely out-of-phase content in the left and right channels. Normal stereo music typically creates a reading that floats between 0 and +1.
Like spectrum analyzers, vectorscopes and phase correlation displays can be tailored to respond as you prefer and take a little practice to interpret. With all meters, use your ears first and check the stereo image meters to spot any problems you didn’t hear. Then decide if you need to make any adjustments based on both your ears and your eyes.
Metering Suites and Bundles
With so many useful metering options, plugin makers often bundle a variety of meters that can monitor every aspect of your mix. For example, a complete meter suite may include level meters, loudness meters, soundfield meters, spectrum analyzers, and dynamic range meters. Many meters even allow you to chart your meter readings over time and print them out. This is mainly for compliance with broadcast standards, but may also be useful when mixing long-format content, like a film.
Many plugins offer hybrid views of your music that not only display a combination of all the various meter types, and also allow you to compare aspects of your mix to a particular reference mix. For instance, a meter may compare the loudness of your mix to another song or a specific streaming service’s standard level. Some meters highlight aspects of your mix that could be further optimized for various streaming services or playback devices and some even allow you to adjust the EQ or levels inside the plugin. Some of these plugins are listed below and are denoted as meters with built-in processing.
Trust But Verify
With all these tools at your disposal, you have everything you need to quickly pinpoint issues in your mix and visually verify what you are hearing. Just be sure you don’t start relying on your eyes too much. Remember, we’re engine-ears, not engine-eyes…
Meters and analyzers help to ensure your mix is free of technical issues. They can aid in making critical mix decisions at the end of a long session when your ears are fatigued. They can also provide a final check of quality control before finalizing your track. During tracking, we use meters to avoid overloading our gear and analyzers to show us where we might want to use a high-pass filter.
Meters should mainly be used to confirm what your ears are hearing and should never be used as the only source of information when making decisions about your mix. The listener isn’t going to be judging your mix based on meter readings! The audience cares about how it sounds—so make that your top priority.
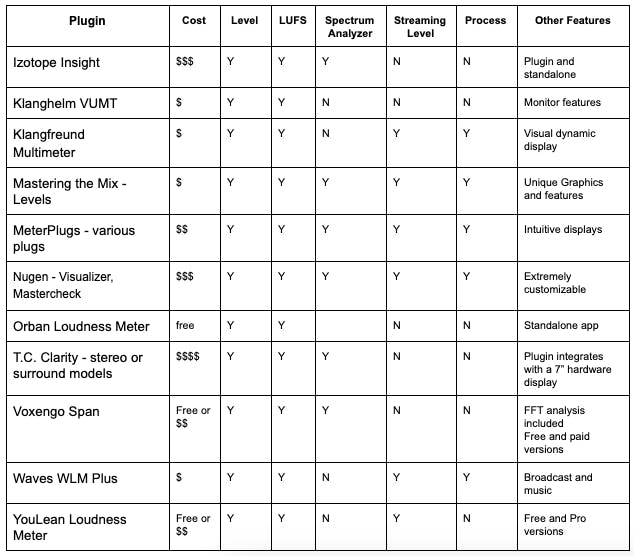
Here is a list of some of our favorite metering plugins and bundles. Each plugin is unique, but the basic functions have been compared. “Process” means that the plugin provides some built-in processing, typically a peak limiter. Only the T.C. Clarity meter comes with a dedicated hardware display unit. A few have free and paid versions, with some differences in features.