Why do we use the Decibel?
In audio, the decibel provides a common unit of measurement that can describe acoustics and electronics. The decibel (dB) is used to describe sound pressure level (dBSPL) in the air, voltage (dBu, dBV) within a mixing console, and power (dBm) in an amplifier. The dB represents a value in relation to a known value, so it’s a ratio. This description can seem vague or intimidating, so here is a simple way to explain the use of decibels:
Imagine you’re comparing money, not sound. If today you have one dollar more than you did yesterday, that’s a linear difference — an absolute amount. But if today you have twice as much money as yesterday, that’s a ratio — a proportional change.
The decibel works on that second principle. It doesn’t tell you how many volts, watts, or pascals you have in absolute terms; it tells you how much more or less you have compared to something else, on a logarithmic scale. Doubling your “money” (or power) equals a +3 dB increase, ten times as much equals +10 dB, half as much equals −3 dB, and one-tenth as much equals −10 dB.
For the decibel to have meaning, we need a known reference point, or anchor. For instance, the anchor for measuring voltage in professional audio systems is 0.775 volts. We signify that anchor value as 0 dBu. The small “u” after the dB signifies that we are measuring voltage in reference to an anchor of 0.775 V. If we double that voltage, to 1.55 Volts, we now have 6 dB more voltage, or a value of +6 dBu.
Each quantity we measure refers to a specific anchor value, and the letter following “dB” identifies which anchor point we are using. Here are some common anchor points and their notation:
0 dB SPL (Sound Pressure Level) is referenced to air pressure measuring 20 micropascals (20 µPa), the threshold of human hearing at 1 kHz.
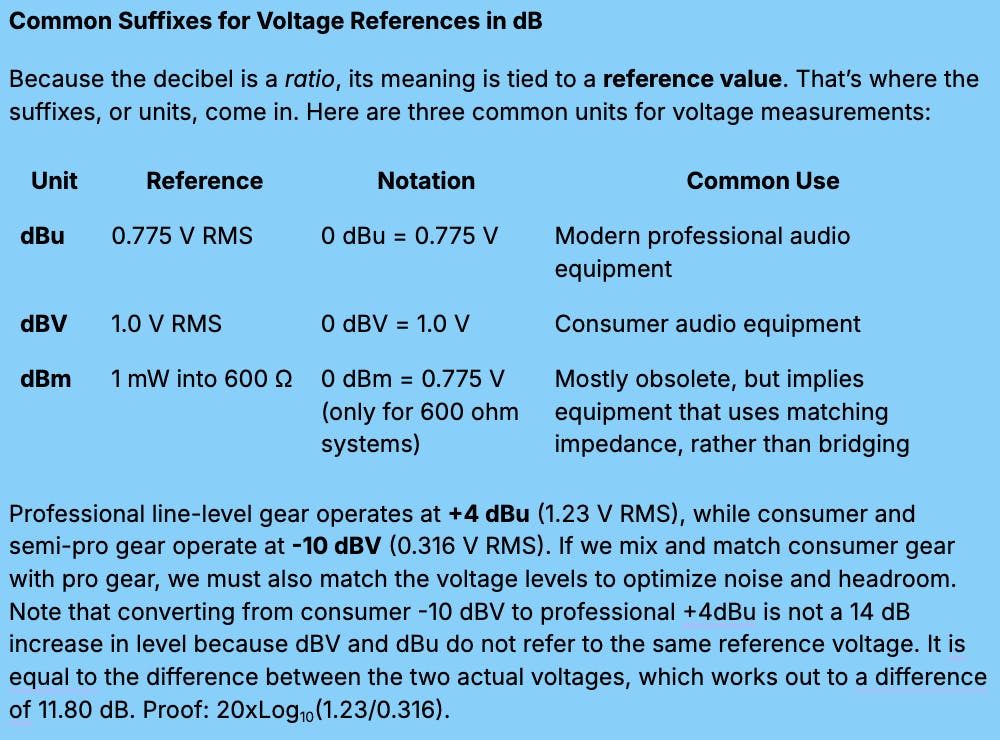
0 dBu refers to a voltage of 0.775 volts RMS (across any impedance), used in modern professional audio electronics.
0 dBV refers to a voltage of 1 volt RMS (across any impedance), used in consumer electronics and audio electronics.
0 dBm refers to a power level of 1 milliwatt, originally standardized for telephone circuits with a 600-ohm impedance.
0 dBFS refers to the maximum signal amplitude in a digital system. All other levels are negative relative to 0 dBFS.
Decibel, What a Strange Name
The decibel sprang from the early telephone industry’s need to quantify signal loss over long transmission lines. In the 1920s, engineers at Bell Laboratories needed a practical method to quantify the power lost between two points in a telephone circuit. They coined the term bel, named after Alexander Graham Bell, to describe a 1:10 ratio of power. If 1 watt of power was lost in one case and 10 watts in another, the difference was 1 bel. The bel proved too large for typical measurements, so the decibel (one-tenth of a bel) became the standard. This method of relating two numbers is useful for comparing vastly different energy levels, including voltages, power, and sound pressure levels for audio measurements.
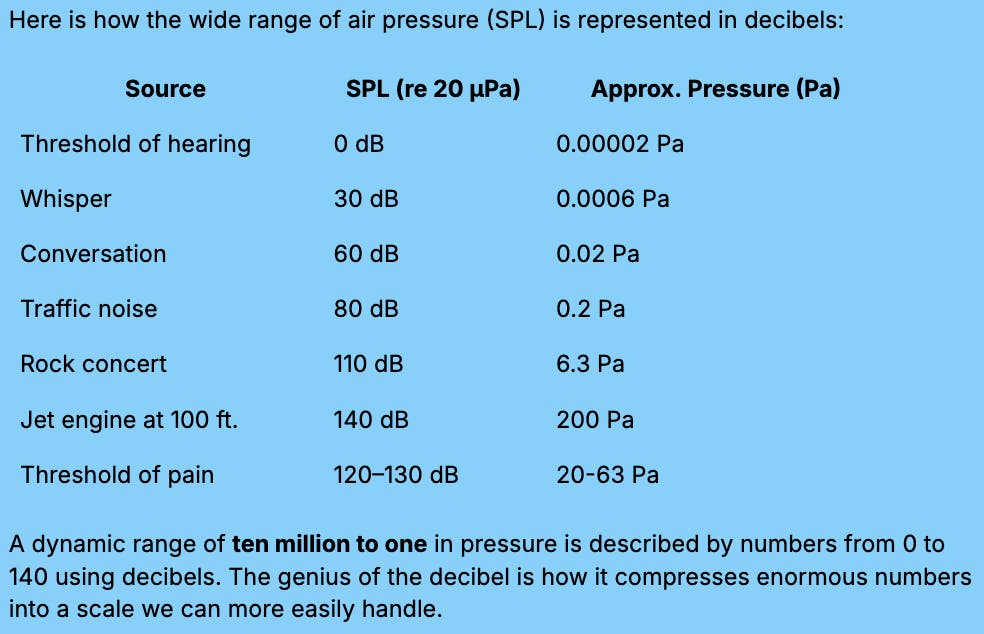
Sound energy and electrical power vary across enormous ranges, so expressing them in linear units is unwieldy. For instance, a whisper and a jet engine differ in air pressure by a factor of 10 million. The decibel compresses this span into a scale of roughly 0 to 140 dB by using ratios expressed as a logarithmic relationship. Decibels simplify the discussion of very large values.
This logarithmic relationship coincidentally mirrors how our ears perceive loudness as proportional changes in intensity. Doubling the power of a signal increases its level by 3 dB, which we hear as only a slight increase in loudness. 10 dB, a 10x increase in sound power, sounds twice as loud. That alignment between physical energy and human perception makes the decibel both mathematically elegant and psychologically meaningful.
Our previous article covers more details about what loudness is, the difference between peak and RMS metering, different ways of measuring sound, and different methods for achieving loudness when mixing and mastering. So in this article, we’ll continue deep-diving into the other aspects.
Using dB to Express Voltage
Voltage: The Language of Signal Flow
In modern audio devices—microphones, preamps, mixing consoles, outboard processors, interfaces, even guitar pickups—the circuitry is designed for voltage transfer, not power transfer. We use the decibel notations for voltages, dBu and dBV, to describe the signal level. dBV has been adopted for consumer electronics, while dBu is used for professional equipment. Fader markings, VU meters, and even digital meters represent voltages.
A microphone typically outputs a few millivolts and plugs into a mic preamp, where the signal level is boosted to line level, about 1.23 volts. The signal increases from 0.001 volts to 1.23 volts, a 1000x increase in level. In decibels, this increase is described as a 60 dB change.
For the math-curious, here is how to calculate the decibel value for a voltage compared to a reference level. For professional audio signals, we calculate the ratio based on a reference of 0.775 V.
Voltage Level (dB) = 20 × log10(V/V0) where V is the voltage being measured, and V0 is the reference to which V is being compared (0.775 volts in our case).
For example:
A condenser mic outputs 20 mV from a singer’s voice.
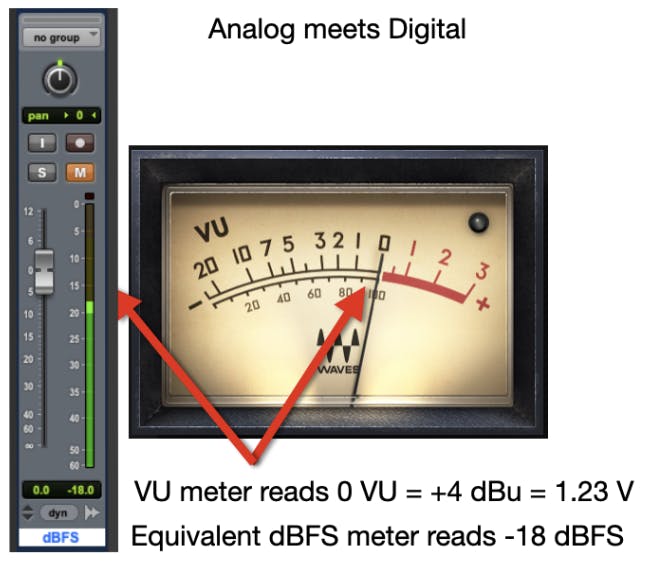
To reach line level, defined as +4 dBu (aka 1.23 V RMS, 0 VU), the preamp must raise 0.02 V to 1.23 V. In decibels, this gain calculation is:
20 × log10(1.23 / 0.02) = 35.8 dB
Note that the above result in dB does not use a suffix (dBu or dBV), because we are only comparing two numbers, and the result is simply a ratio expressed as dB. If we directly describe a voltage, like 0.775 volts in the context of professional audio gear, we would write 0 dBu, which describes a voltage level as compared to the reference level for dBu.
Quick Tip: It’s handy to memorize that for voltages a 6 dB increase means the voltage has doubled, while a 20 dB increase represents a tenfold change, and a 60 dB increase represents a 1000x change. In practice, we use a calculator to determine dB, and we have created a web-based calculator for this purpose.
Open the decibel calculator in a new tab
Using Decibels to Express Power
Between line-level studio devices, the goal is clean voltage transfer. Once the signal leaves the mixing or playback chain and enters the amplifier–loudspeaker system, power becomes a more meaningful measure. An amplifier must deliver enough current and voltage to overcome the speaker’s impedance and move air with authority. Voltage and current are linked through impedance, with the formula being P = V2/R, where P = power, V = voltage, and R = impedance.
When applied to power, the equation for the level in decibels is slightly different than for voltage because power is proportional to the square of voltage, as in P= V2/R.
Power Level (dB) = 10 × log10(P/P0) where P is the power being measured, and P0 is the reference to which P is being compared
To increase an amplifier from 1 watt to 2 watts, the equation would read:
dB = 10 × log10(2/1) = 3.01 dB
We see that doubling our amplifier power corresponds to only a 3 dB increase in power, meaning that a 3 dB increase requires twice the amplifier power! That’s why going from a 100 W amp to 200 W barely feels louder, but 1,000 W makes a noticeable jump. It’s also easy to remember that ten times the power equals a 10 dB increase.
Using dB to Express SPL
For sound pressure level (SPL), the decibel describes the ratio between a measured acoustic pressure and a reference of 20 micropascals (the threshold of human hearing). Because acoustic power is proportional to pressure squared, the 20-log rule applies. As previously mentioned, this formula brings an extremely wide range of measurements—from barely audible to painfully loud—into a scale of roughly 0–140 dB:
SPL (dB) = 20 × log10(p/p0) where p is the pressure being measured and P0 equals the reference value of 20 micropascals (2 × 10⁻⁵ Pa)
Our hearing operates on a kind of decibel scale, and this alignment between physics and perception is no coincidence. The decibel conveniently mirrors how we experience changes in sound. For the average listener, the smallest detectable difference in loudness is about 1 dB under ideal conditions. A 3 dB change is clearly audible. A 10 dB change feels roughly “twice as loud.”
85 dB SPL is often referred to as the standard listening level because our hearing is most linear at this volume. At lower or higher levels, our perception of the frequency content shifts, as described by the Fletcher-Munson curve. That’s why engineers should mix at moderate levels and why broadcast and film standards recommend calibrating monitors in a dub stage to 83–85 dB.
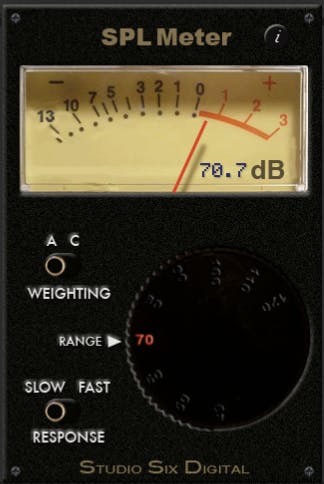
SPL meters use weighting filters that approximate how our ears respond at different loudness levels. In practical terms, C-weighting (dBC) captures the acoustic power of full-range sound systems, useful for concerts, studios, and system tuning. A-weighting (dBA) emphasizes midrange frequencies where the ear is most sensitive, and is appropriate for judging potential hearing damage and background noise levels.
Using dB to Express Digital Signal Levels
In digital audio, the reference isn’t a real-world voltage anymore but full scale (FS)—the maximum amplitude the digital system can represent. We use dBFS (decibels relative to full scale), where 0 dBFS represents the maximum possible signal before clipping, and all other values are negative. The music studio standard defines the relation from analog levels to digital as 0 dBu (1.23 volts) = -18 dBFS. Post-production studios often use 1.23 V = -20 dBFS as a standard.
Perceived Loudness Measurements
Loudness refers to how humans perceive the energy in a sound, and we use LUFS to describe this measurement. Loudness Units (dB) relative to full scale (FS). LUFS measurements account for how human ears perceive different frequencies at various levels, making it a more accurate representation of perceived loudness than simply measuring a signal’s RMS energy level. Put another way, LUFS and dBFS both describe levels in digital audio, but they represent the audio level using different measurement methods.
dBFS measures signal amplitude — it’s a purely electrical or mathematical scale where 0 dBFS represents the maximum possible digital level before clipping. It tells you how strong a signal is, but not how loud it sounds.
LUFS, on the other hand, measures perceived loudness. It’s based on psychoacoustic models standardized by ITU-R BS.1770 and integrates both the signal’s amplitude and the ear’s sensitivity to different frequencies over time. LUFS accounts for how humans perceive loudness. Two music tracks with the same peak at 0 dBFS might register very different LUFS values and sound very different to our ears.
Peak Measurements in Digital Audio
In digital systems, a signal must never exceed full scale, or digital “zero,” so we monitor its level using a peak meter. However, there are two types of peak measurements to be aware of. Sample peak and true peak both describe how close a signal gets to the system’s ceiling (0 dBFS), but they do so in different ways.
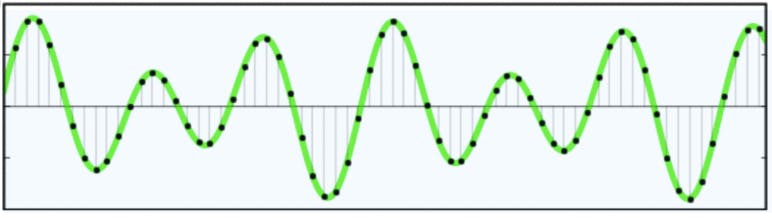
Remember that a digital system represents an analog waveform by measuring the signal’s amplitude once every sample period. At a sample rate of 44.1 kHz, for example, the system takes 44,100 measurements per second. These samples can accurately reconstruct the analog waveform. Interestingly, the highest sample value may not reach the highest level of the reconstructed analog waveform. This image shows how that works:
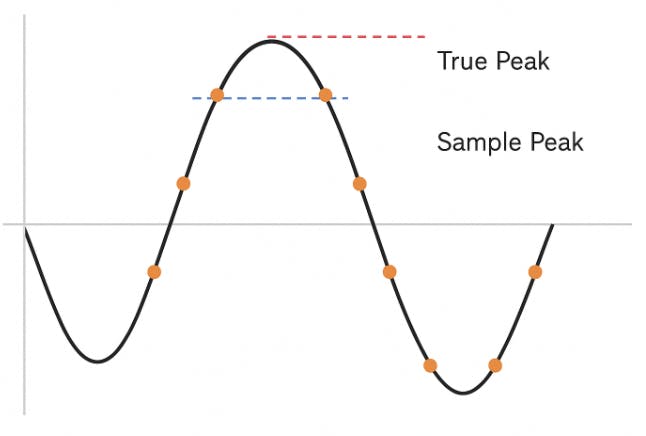
The orange dots represent the sample values stored when the analog signal is converted to digital, while the black line represents the actual analog waveform. Note that the highest stored sample values are lower than the peak analog value. That is why there are two types of peaks, true and sample.
A sample peak meter represents only the instantaneous value of each digital sample—the discrete points stored in the file. It shows the maximum value that any sample reaches relative to full scale. However, when the digital values are reconstructed into a continuous (analog) waveform by digital-to-analog conversion, the actual analog waveform can swing slightly above the highest digital sample value.
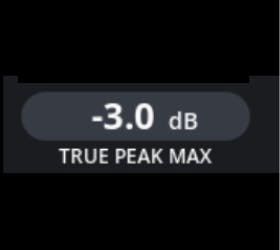
That’s where true peak comes in. A true-peak meter mathematically interpolates between samples (through oversampling) to estimate the amplitude of the reconstructed waveform. The meter can display the value of these inter-sample, true peaks. True-peak measurements give a more accurate indication of potential clipping when audio is converted back to analog or encoded to compressed formats like MP3 or AAC.
Sample peaks indicate if our digital data is clipping, while true peaks indicate whether the reconstructed analog signal will clip. The difference between the maximum sample peak and the true peak level can easily exceed 1 dB and may approach 3 dB. Interestingly, higher sample rates shrink the difference between sample and true peaks because the samples are spaced closer together in time.
Because of this, it’s recommended that final masters be created while monitoring a true-peak meter and using a true-peak limiter, ensuring the finished audio remains distortion-free across playback and encoding systems.
The Analog–Digital Alignment
Why the Difference Matters
Analog gear handles brief transients gracefully because its circuitry can often saturate gently without harsh distortion. Digital systems, by contrast, clip abruptly at 0 dBFS, producing instant hard-edged distortion. Because of this need for headroom, engineers align analog average levels (VU) well below digital peak levels (FS).
A mix that averages 0 VU on an analog meter typically corresponds to around -18 dBFS RMS in a DAW. Both represent healthy, nominal levels with adequate headroom for peaks. Pushing levels to get the digital levels near 0 dBFS will likely overdrive the analog gear and risk digital clipping.
To bridge these two systems, studios established calibration standards that map a known analog voltage to a specific digital level. The most common alignments are:
| Analog Level | Digital Equivalent | Usage |
| +4 dBu (0 VU) | –20 dBFS | U.S. broadcast and film studios |
| +4 dBu (0 VU) | –18 dBFS | Most music studios and EBU standard |
The Practical Takeaway
Levels for recorded audio can be represented as dBu, VU, dBFS, and LUFS, so how do we know when to use each measurement type?
Analog
dBu measures the analog voltage of an audio signal, based on the professional reference of 0.775 volts RMS. It’s the standard for professional line-level audio, where +4 dBu = 1.23 V.
dBV is similar to dBu but uses a 1-volt RMS reference, the standard for consumer and semi-pro equipment operating at lower nominal levels. –10 dBV = 0.316 V.
dBm represents power, referenced to 1 milliwatt into a 600-ohm load. It’s based on vintage standards and is mostly obsolete now, though it sometimes appears where dBu is more appropriate.
VU meters display the average loudness of a signal, roughly reflecting the perceived loudness of speech, averaged over a very short time. VU meters do not typically display peak levels.
SPL meters measure acoustic pressure in the air — how loud the sound actually is in physical space, referenced to 20 µPa, the threshold of human hearing at 1 kHz.
Digital
dBFS (decibels relative to full scale) indicates how close a signal is to the digital ceiling, where 0 dBFS is the maximum amplitude before clipping.
LUFS measures perceived loudness over time, using psychoacoustic weighting. It provides a more accurate representation of how loud a complete mix or program sounds to the human ear.
Sample peak measures the highest digital sample value in a waveform. It shows how close individual samples get to full scale, but doesn’t reveal what happens between samples when the audio is reconstructed as an analog waveform.
True peak estimates the actual reconstructed waveform. It detects inter-sample peaks that can exceed 0 dBFS even when no sample does. Because of this, final masters should be checked with a true-peak meter and kept safely below 0 dBTP.


