Abstract
This research provides an analysis of the headphone market on a model level. The headphone market is highly consolidated with the top 10 headphone models together representing 36% market share and the top 3 models 19% market share. The model-based market shares were combined with the measured frequency response of the corresponding headphones to calculate the weighted average headphone sound. The resulting average headphone frequency response has similar boosts in bass and treble representing a symmetrical “smiley curve”.
About Sonarworks
Sonarworks is a deep-tech audio company that specializes in sound device measurements, digital tuning, and acoustic research. The company has developed state-of-the-art proprietary measurement equipment and software, and digital signal processing tools. Sonarworks is developing software for sound professionals as well as providing its technology to consumer sound device manufacturers. SoundID Reference is a market-leading product for speaker and headphone sound calibration with over 140k professional recording studios as users. SoundID headphone tuning app has over 1M downloads globally with 4.7 star rating.

Research Goal
There are over 1000 headphone models in the market and it has been well documented that there is no consistency in frequency response among them (here is our headphone calibration whitepaper). It has become increasingly common for music creation to take place at least partly on headphones, rather than on speakers. This shift aligns with the surge in the popularity of headphone listening among consumers. Headphones provide isolation from external noise, are mobile, and offer a personal and portable listening experience. Sonarworks’ aim is to optimize the translation of audio from the creators’ studio to the consumer. Quantifying headphone performance will assist creators in producing audio that will be enjoyed by the broadest audience possible.
This report will provide a model-weighted global average headphone frequency response curve. This frequency response curve can be used by production professionals to understand how their content will translate to the average listener. The headphone average will be weighted by their modeled market share to accurately represent market reality. This is hugely important since the headphone market is significantly consolidated despite having a lot of market players.
Professionals choose their equipment, including headphones, for precision and reliability, and the cost of those systems is seen as a business expense. Consumers may choose headphones based on cost, sound quality, brand-name recognition, or perhaps something else. Regardless of how consumers select their headphones, our goal is to quantify the average frequency response of their headphones.
Data Collection
Sonarworks has the world’s largest headphone frequency response measurement database with close to 10,000 headphones measured. We conducted extensive market research in order to estimate headphone model-specific market shares. We combined data from 19 sources to build a model that depicts the market share of 24 different headphone brands, each possessing a market share exceeding 1%. We did exclude headphone brands with less than 1% market share since these brands and corresponding models would have little impact on the overall result, however, would greatly increase the cost and complexity of the research. We then utilized several data sources to determine the relative individual model popularity within each brand. These sources were the Sonarworks consumer app SoundID, which at the time of research had close to 1M users globally, and online retail review count analysis from 16 stores around the world, encompassing a total of 15.9 million reviews. It must be noted that these data points were chosen based on data availability and are proxies for market shares thus there might be some error in our estimates. Feedback and suggestions on more data sources are very welcome.
The above-mentioned criteria included 162 headphone models from 24 brands. Figure 1. Shows headphone model distribution by market share (research conducted for the years 2021-2022).
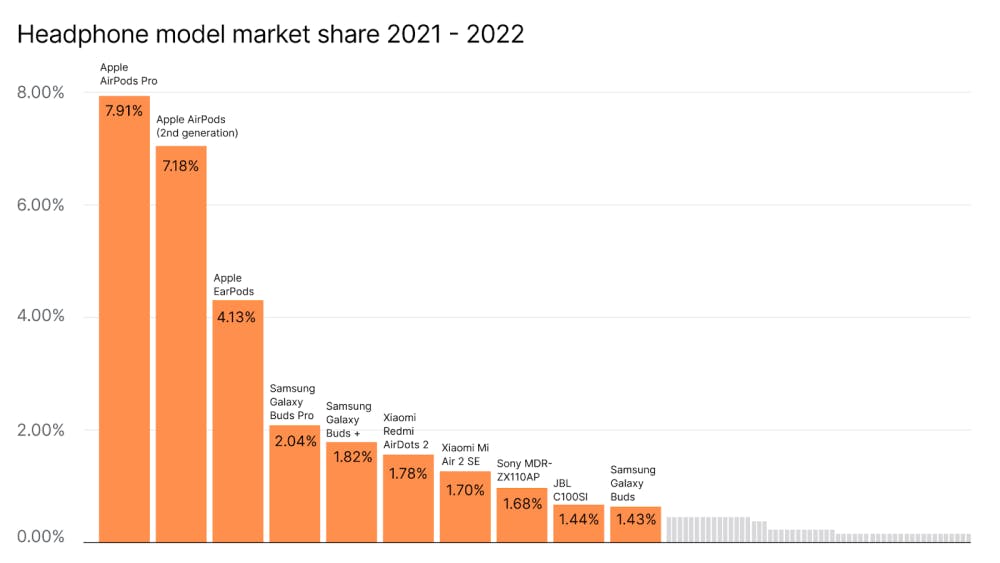
We at Sonarworks were well aware that the market is rather consolidated towards the most popular headphone models, however, these results surprised us in regards to how extreme that concentration is. On an anecdotal level, these results do comply with observations in real-life situations in public spaces.
The consumer headphone market is overwhelmingly dominated by the top 10 models (in orange), in total, accounting for 36% of the global market and only 17 models exceeding 1% market share. The 3 most popular headphone models are all Apple brands and account for 19.2% market share.
Global Average Headphone Sound
Since Sonarworks is continually measuring and updating its database of headphone frequency response measurements, we can use the market share data to create an average global frequency response curve. Figure 2 below illustrates results for the average frequency response of the top 162 most popular headphone models weighted by market share:
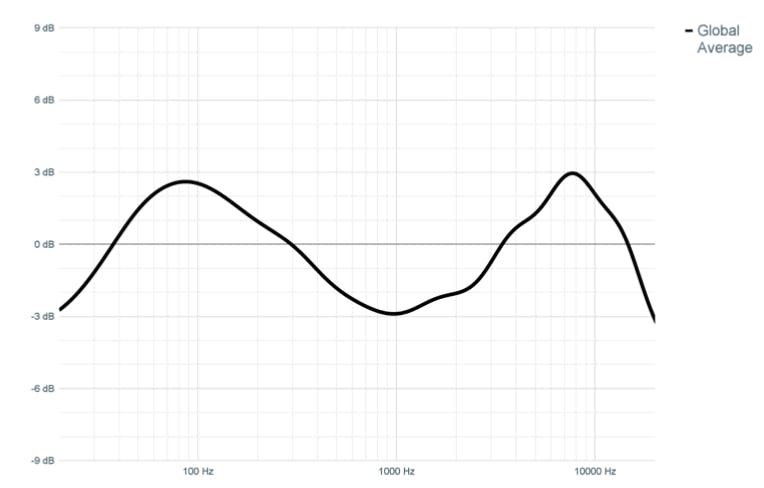
This global average clearly shows a smiley-face curve, with equally elevated bass and high frequencies and a rapid roll-off above 7 kHz and below 90Hz. The roll-offs are determined by the physical headphone driver limitations rather than representing design goals.
Many sound professionals have realized that the content they create in recording studios on speakers is then experienced by the consumer on headphones. Sound professionals are often confused as to what sound to use as a reference point and are often relegated to sound checks on specific headphones. Using specific headphones as a sound checkpoint is a rather unreliable practice since individual headphone frequency response can be widely different than neutral studio reference (read more on studio reference). The weighted average headphone frequency response curve is important as a reference point for consumer headphone use-case and we expect it to be more informative compared to any individual headphone. The average curve should be used as the consumer use-case reference point and should translate well to the widest range of devices. Figure 3 below shows how the top 162 headphone models compare to the global weighted average.
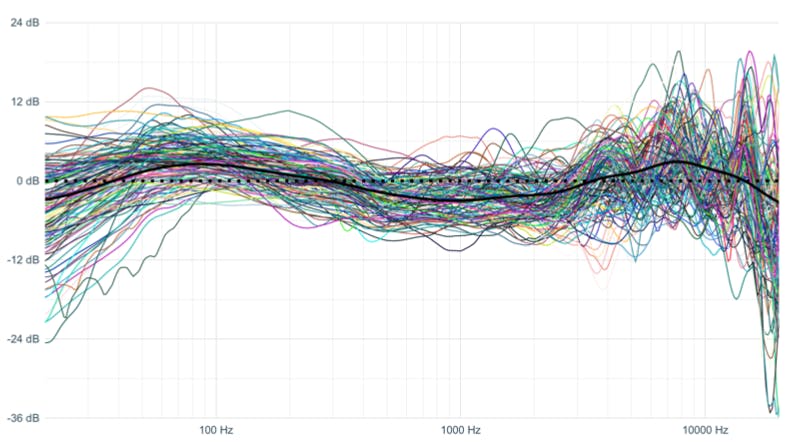
Individual headphone frequency response can be significantly off from neutral flat, which is the most common sound target for recording professionals (here is a separate publication for more details on recording references). This is mostly due to limitations of headphone hardware that bring significant frequency response compromises, especially in higher frequencies. It can also be seen in Figure 3 that not all headphones have low and high-frequency roll-offs, however, they are a factor on average. Due to these individual FR deviations, we do not see value in using any individual consumer-grade headphones as a reference sound-check for professionals.
Global Average Sound By Headphone Type
In-ear (49%) type headphones account for the most used models by model count, with over-the-ear (30%), on-ear (14%), and earbuds (7%) trailing behind. Even though there are fewer earbud models in the market, these account for 17.3% of the impact. Figure 4 illustrates the four different headphone types.
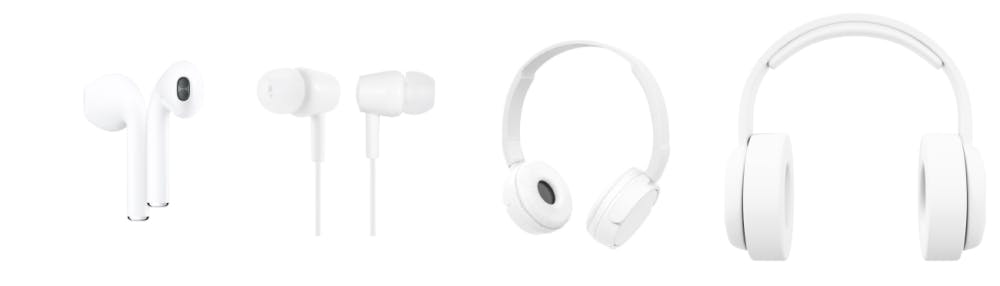
Figure 5 below illustrates the global weighted average frequency response of the different types of headphones. You should notice that the global weighted average most closely resembles the in-ear curve (shown in red), as it is the most commonly used type of headphone.
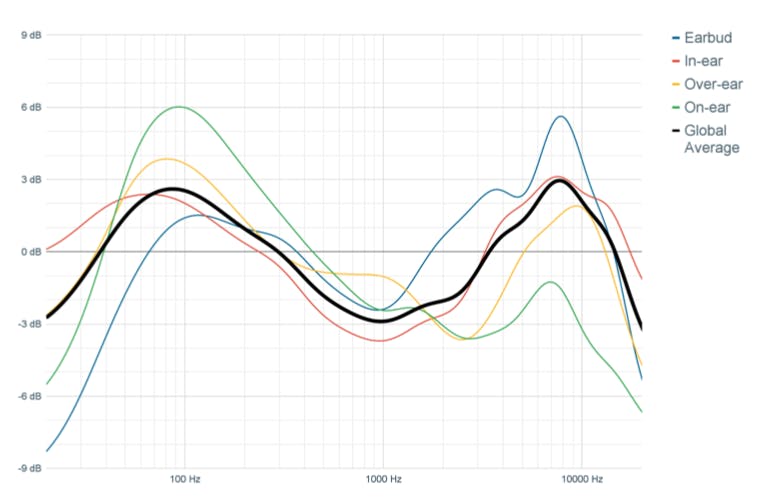
Most professionals use over-the-ear models for sound production and mixing tasks. If the headphone use case is the primary target then it is important to note a 4dB lower average frequency response for higher frequencies. Regardless of the headphone type of choice, we would suggest using digital calibration of headphones, especially for professional use cases.
Does Geography Matter?
We also looked at geographical differences in headphone model popularity in order to determine if there are average sound differences. North America, Latin America, and Europe are almost identical as the most popular headphone models are universal and dominate regardless of market. Unfortunately, China and India were left out of our research due to a lack of available data. It’s possible that in Asia there could be a different popularity pattern. We hope to be able to shed more light on this in the next research.
Does Price Matter?
We also looked at the market breakdown into price categories using $100 price ranges for the categories (Figure 6). Unsurprisingly, cheaper headphones are more impactful in terms of consumer engagement.
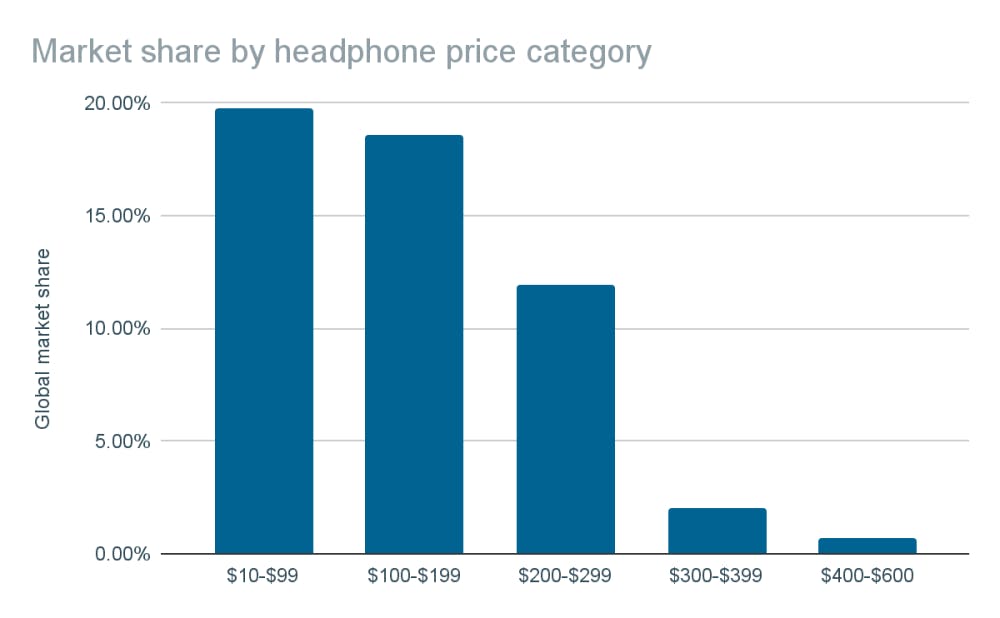
Price categories above 200$ have a 15% market share and we expect that would not have been the case 10 years ago. The last 2 decades have been a victory march of headphones as the main means of listening both in terms of budgets allocated as well as number of units sold. A takeaway here for professionals is to be mindful that the high-end expensive headphones you probably rely on do not represent the market reality of consumers.
How to use the global headphone curve
We are planning to include this global headphone curve as one of the predefined translation check targets in the SoundID Reference product line. This will allow any professional to apply the target on SoundID Reference-supported headphones and switch back and forth between any other desired targets. Our hypothesis is that using a global headphone curve will produce better sound translation to the headphone use case in general. This target should also save mixing and mastering time by avoiding the circle of confusion from referencing individual headphones that each produce wildly different results.
Conclusion
Our goal is to enable creators to understand how their content will sound to consumers so that the best decisions can be made during the production phase to ensure an accurate translation to the broadest audience possible. Our research on consumer headphone listening leads to the following conclusions:
→ A few headphone models and brands dominate the headphone market and therefore largely determine the average sound of consumer headphones.
→ The average headphone sound is a smiley-face curve with an equal boost in bass and highs.
→ The average headphone sound is virtually the same across Europe, North America, and Latin America.
→ The global headphone average is perhaps a better reference target sound than any individual headphone model for a general consumer headphone use case. We are eager to get feedback from professionals after using the global average as a reference target.
As a practical tip, we suggest content producers use the global headphone average as a finetuning reference to have a better understanding of how the material is going to sound on headphones. Keep in mind the global headphone average will only work as intended with SoundID Reference calibrated headphones (stay tuned for this target to be added to the SoundID Reference product). It is still better to use flat as a general FR reference, however, the global headphone average is better than using individual headphones to finetune your mixes and masters.