As thoughtful consumers, we try to make informed choices which often include a cost-benefit analysis as part of our decision-making process. When deciding to purchase slightly more expensive tires for our car, we try to determine the benefits vs cost. Do the more expensive tires provide a better ride, better wear or more safety? Often in the studio world, we wish to demo something to see how it works in our particular environment to help us decide on a purchase.
Demoing an audio product usually requires a bit of investment in time to install software, rewire our setup or in money to purchase a piece of equipment that facilitates demoing some particular device. Recently I wanted to demo Nuendo 10.5 software and realized that I needed to purchase a USB e-Licenser in order to run the demo. The same is true for iLok protected products. A similar situation exists with needing extra speaker cables to demo a second set of monitors or needing a second mic stand or cable to easily A-B two microphones. Usually, the cost of the extra devices is minimal compared to the proposed investment and often the extra device is useful in other ways—that extra mic stand or cable will eventually get used.
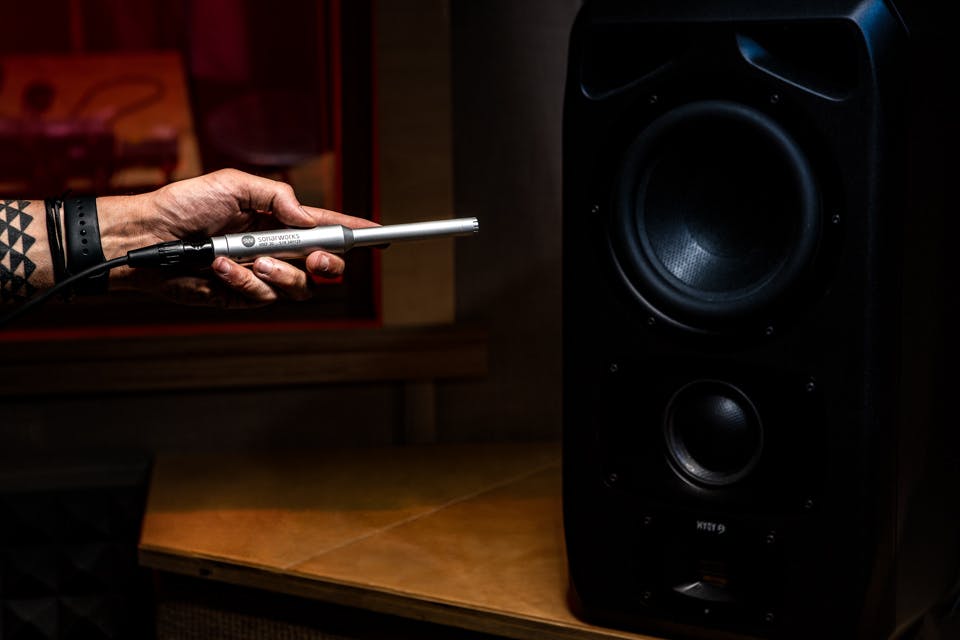
Sonarworks provides a free 21-day trial of their software, which allows trying the software with your current headphones and gives you plenty of time to run through all options in the software. However, if you would like to demo Sonarworks Reference room correction software, you will need to measure your monitors and create a calibration profile, or EQ correction curve, for your room. The recommended Sonarworks Measurement Microphone comes bundled with certain products and is also available for purchase for $69 (USD), and comes with a 21-day free software trial. You can also use your measurement microphone (read Sonarworks article here) and use your own microphone calibration file (read more here). Our friends at Pro-Tools-Expert.com recently published a blog post that presented the question “Do you need a measurement microphone to setup speaker calibration?” Their hope was that we already own a mic that will allow us to run a decent trial of Sonarworks Reference.
The article tested a few common microphones and developed a theory that these microphones will give you a sense if Sonarworks may work in your studio. Sonarworks, as well as other companies, recommends you only use calibrated measurement microphones for room correction. We’ll dive into this subject to make things a bit clearer for when you decide to tune your room.
Let’s take a minute to explore what measurement microphones are and why most microphones are not suitable for accurate measurements. To begin with, our ears behave more like omnidirectional (pressure sensitive) microphones than uni-directional microphones, so we want to think about using omni mics for our measurements. We want our measurement mic to have an extremely flat frequency response from at least 20Hz to well over 20kHz. Measurement microphones utilize small capsules (8mm or so) for an accurate high-frequency response and a polar pattern that remains consistent at all frequencies. Large-diaphragm mics become increasingly directional (narrow focus) at high frequencies and almost omni at low frequencies. Studio microphones, especially those with large diaphragms (≥ 27mm) may have flattering characteristics for recording but do not work well for accurate measurements.
Measurement microphones range in price from under $50 to a few thousand dollars, however, even inexpensive measurement microphones can perform accurate frequency measurements. More expensive measurement mics, like those from Earthworks or NTi, will have lower distortion, lower noise, higher sensitivity, and better build quality. Also, less expensive mic may use electret condenser elements, instead of true condenser elements and electrets may lose accuracy over years of use.
All respectable measurement microphones come with a unique calibration profile, or measurement file, that provides your measurement software with the exact frequency response of your particular mic. This profile is used to subtract out the measurement error from the test data. After-market microphone calibrations can be performed by companies like Cross Spectrum Labs and calibration profiles can be generated should you require a calibration file for any microphone.
In the examples below, I used Fuzzmeasure (https://www.rodetest.com/) software to measure and compare different microphones. The graph below shows a Sonarworks XREF measurement microphone along with a Behringer ECM 8000 measurement microphone that I bought used on EBAY a few years ago. I played Fuzzmeasure’s sweep tone through uncorrected studio monitors and the image below compares the two microphones’ frequency responses to each other.
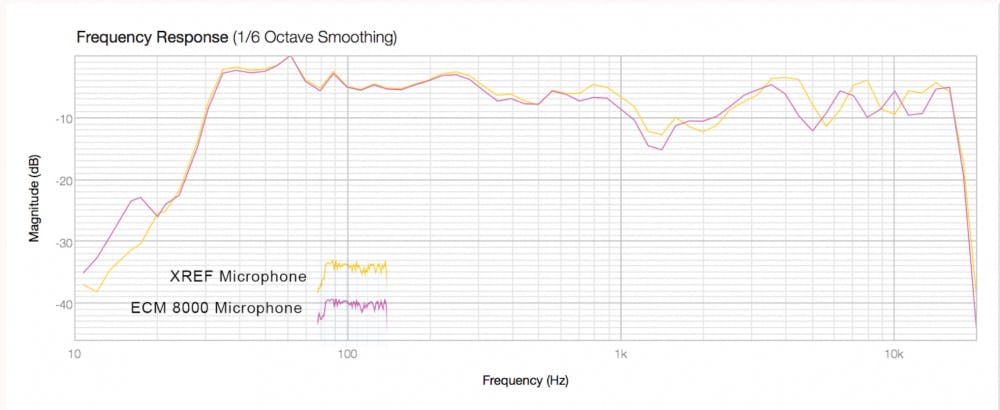
The graphic shows that the Sonarworks XREF and the Behringer ECM 8000 match very well below 600Hz, but above 600Hz, differences of up to 5dB can be seen. In practice, both of these mics come with a calibration profile that will mostly correct these discrepancies. Ths XREF mic comes with a profile that is generated from that specific mic (with a specific serial number) while the Behringer measurement mic’s profile is based on average tests of several mics and not the specific mic you are using.
Additionally, when measuring your room, Sonarworks Reference Measurement software takes more than 25 measurements around the listening area and averages the room measurement. That way small measurement errors become even less significant. Even without applying their calibration files, both of these mics perform extremely well, especially in the critical low-frequency region.
To investigate the possibility of using some common studio mics, I tried some small diaphragm microphones from my locker. I mainly tried omnidirectional mics, but I threw in some cardioid capsules for comparison. Notice that my graphs display ⅙ octave smoothing. Most audio marketing specifications use ⅓ octave smoothing for speakers and microphones. ⅓ octave smoothing is not really accurate enough to show what’s really going on. Room response is often viewed at resolutions as high as 1/48th octave. I want to show a reasonable amount of detail in these graphs, so I’ve chosen ⅙ octave smoothing for these examples. Note: See the sidebar at end of this article for more on smoothing.
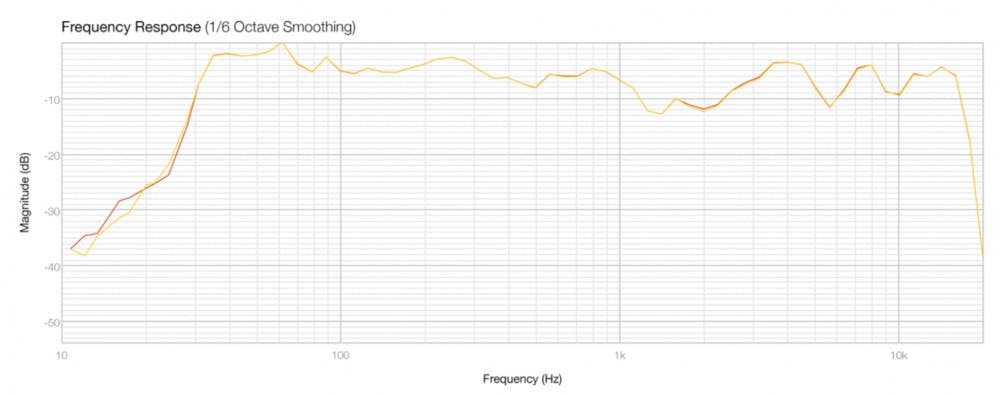
To test the accuracy of my test setup, I mounted the Sonarworks XREF mic on a mic stand where my head would typically be and measured the XREF mic twice, about 5 minutes apart. This overlay shows that the test setup is repeatable. Above 20Hz, the two traces are virtually identical.
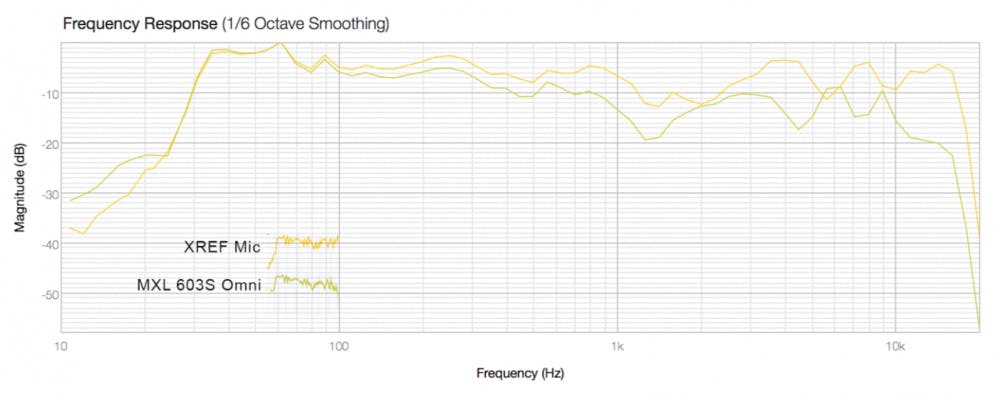
Next, I tested the XREF against an MXL 603S with an omni capsule. The MXL veers away from the XREF above 100Hz. The differences in these mics show that the MXL may provide reliable low-frequency measurements, but we can’t be sure about the highs.
Since many of us have mainly cardioid microphones, I wanted to show the difference in frequency response between omni and cardioid mics of the same model. Here is a comparison of the MXL 603S with both a cardioid and an omni capsule.
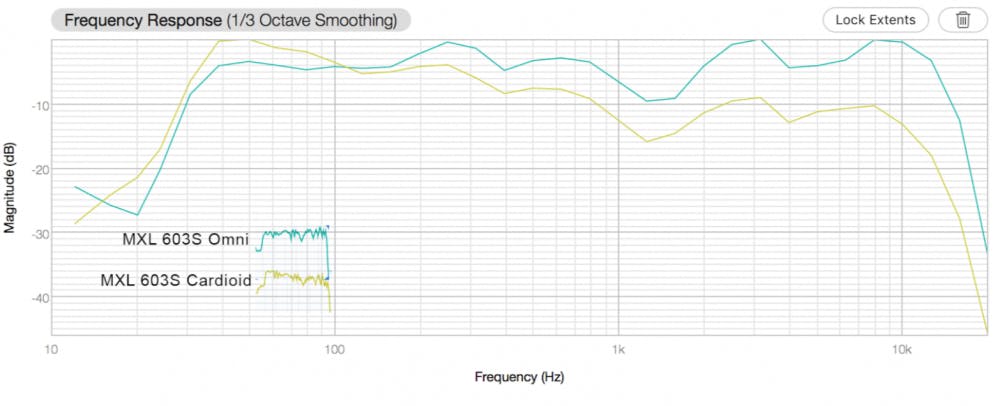
Clearly, the two MXL mics have opposing frequency tilts, so using one mic versus the other as a measurement microphone will yield drastically different results. I tried this same test with other brands and omni and cardioid mics of the same models followed similar trends as above.
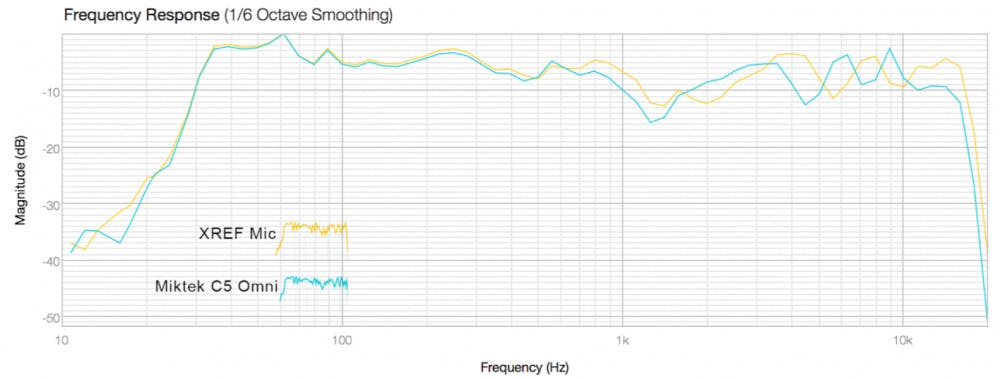
Here is a comparison of the XREF to the Miktek C5 with an omni capsule. In this test, the C5 and XREF behaved very similarly below 1kHz, followed a similar contour up to 4kHz and then showed opposing measurements. The Miktek C5 would be better than an MXL 603S for measurements but above 3kHz this C5 may not be trustworthy.
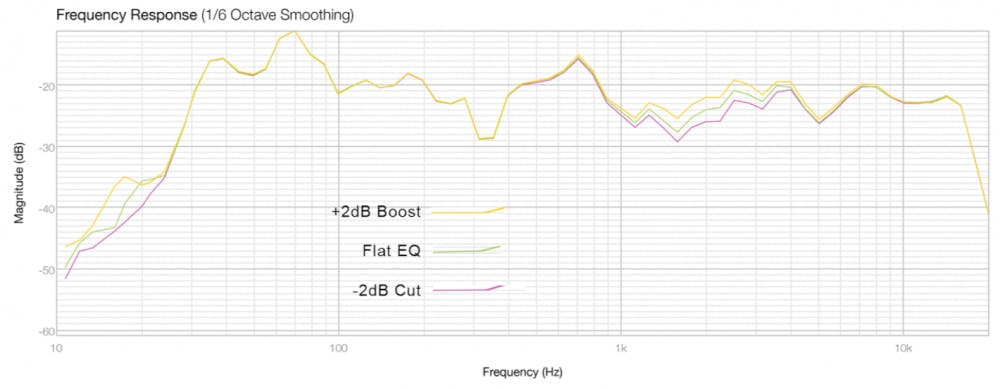
I also wanted to verify that the measurement mics accurately captured small changes in frequency response, so I applied a 2 dB cut and boost at 2kHz and took three measurements with each mic. All the mics I tested correctly tracked the changes in EQ. The measurements below were made with an Ashman SOM50 SuperOmni microphone.
From these images and descriptions, you can take away that each mic can accurately capture changes in frequency response, so it can, indeed, create a measurement of sorts. Measuring changes, however, will never tell us when our monitor response is flat. I wouldn’t recommend that any mic, except a calibrated measurement mic, be used to tune your room or even audition Sonarworks software. An analogy to that would be frying some food in peanut oil because olive oil is too expensive and you just want to see if it works. Of course, the peanut oil will work to fry the food, but the flavor will be nothing like the flavor of frying olive oil. Using any old mic to test Sonarworks will show you that the software records measurements of your and can create a curve, but that curve is based on inaccurate measurements and will likely not be an improvement to your existing problems.
Don’t skimp on using a true measurement mic to test your room or even to audition room correction software. Buy an inexpensive calibrated mic and if you decide you don’t need to keep the mic, put it up for sale and someone will surely buy it. Pro-Tools-Expert.com surveyed that 59% of their production community “cannot live without speaker calibration software in their studio.” Download a demo of Sonarworks software and if you intend to try the software on headphones, you’re good to go. If, however, you want to measure and calibrate your speakers, please borrow or buy a calibrated mic and try it for real. I don’t think you’ll be disappointed.
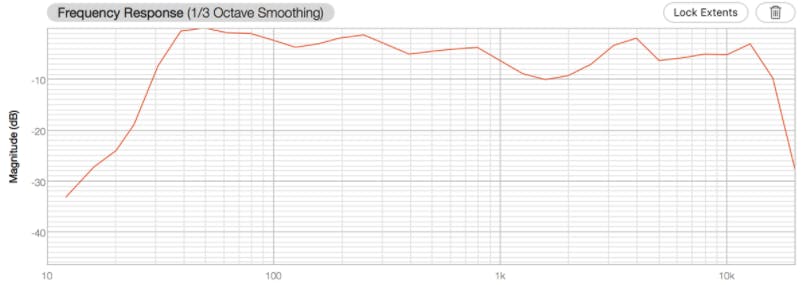
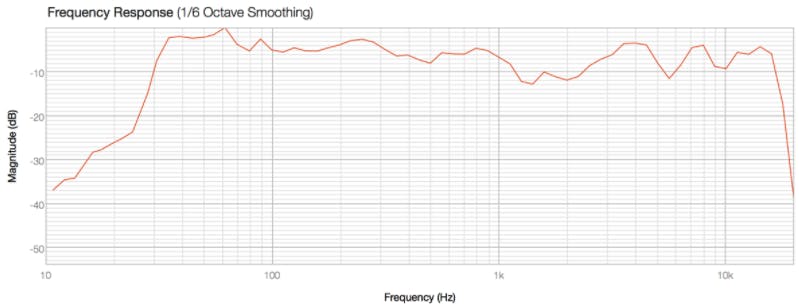
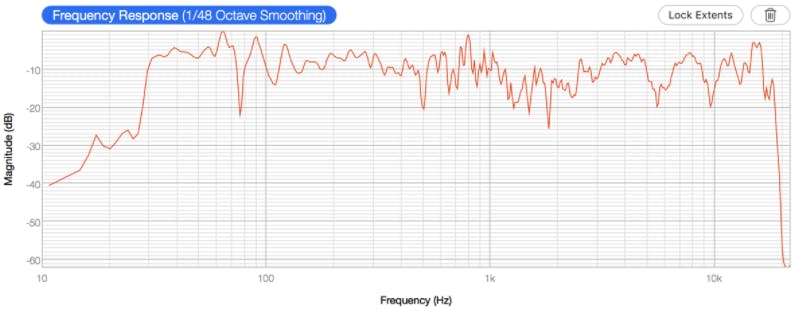
| Smoothing and how it hides data. The graphs below all represent the same measurement but have different smoothing applied. 1/48 octave smoothing divides each octave into 48 measurements. ⅓ octave smoothing only divides each octave into three measurements, so we don’t know what happens between those measurements. Comb filtering and audio anomalies often have very narrow bandwidths with large amplitude changes. A deep notch that is ⅙ octave wide at 80Hz may not show on a ⅓ octave chart but will wreak havoc with frequencies around the notes of D#2, E2 and F2— the open low E-string on the acoustic guitar or the open D string on the bass guitar. Take a look at the three graphs below to see how smoothing hides some very ugly dips in the frequency response. Notice the almost 20 dB dip at 74Hz on the bottom graph that is completely smoothed over in the top graph. The ⅓ octave graph would lead us to believe that there is no frequency dip around 70Hz when we can clearly see the dip in the 1/48 octave graph. |